1.Introduction
The current COVID-19 pandemic is increasingly recognized as a serious worldwide public health concern, causing anxiety and stress around the world. In this context, the issue of the impact of pandemic on macroeconomic performance has attracted a lot of attention. Numerous studies have attempted to explore and explain the interaction between pandemic and macro-economic variables, such as banking and insurance performance (Leoni, 2013), governments and public (Cummins, 2006), and financial markets (Chen et al., 2018; Elnahas et al., 2018). Results from earlier studies have demonstrated a strong association between pandemic and macroeconomic performance, owing to the enormous economic cost of pandemic (Bloom et al., 2018).
However, to date, there has been little agreement on how the COVID-19 pandemic affects crude oil and stock markets. Theoretically, the spread of COVID-19 pandemic will restrain crude oil demand, which will lead a decline in crude oil prices and returns. Meanwhile, the outbreak of COVID-19 will also affect the investors’ expectations, which may cause stock returns to fall. Specifically speaking, on the basis of the real options theory, investors owe the right to take different actions in order to deal with possible risk and uncertainty. Investors, principally, can delay investment decisions and investments. During the period of COVID-19, investors may opt to delay investments consistent with the real options theory, which will eventually reduce the stock returns.
However, it is still unknown to what extent the COVID-19 pandemic affects the crude oil and stock markets. Determining the impacts of the COVID-19 pandemic is not only significant for formulating the appropriate investment strategy for investors in advance, but also crucial for governments to deal with the possible fluctuation in crude oil market and stock market. Therefore, the primary aim of this paper is to explore the interaction among the COVID-19 pandemic, the crude oil market and the stock market by utilizing the dataset of U.S. COVID-19 pandemic.
Noteworthy here is that there is a large volume of literature emphasizing the interaction among crude oil market, stock market and macro-economic variables (Lee & Zeng, 2011; Wang & Lee, 2020). Although previous research findings into the oil-stock nexus have been inconsistent and contradictory (Balcilar et al., 2019; Basher et al., 2018), it can reveal the fact that exploring the epidemic-crude oil nexus and epidemic-stock nexus separately is not satisfactory. For example, it has been demonstrated that there exists a positive relation between crude oil prices and stock prices (Zhu et al., 2014). By contrast, a negative association between crude oil prices and stock prices is also confirmed by Narayan and Gupta (2015). Hence, ignoring the relationship between the crude oil market and the stock market and investigating the effect of the COVID-19 may contribute to model misspecification problems and lead to inaccurate results and conclusions. To this end, we attempt to investigate the nexus among these three variables in a unified framework.
Regarding the estimation technique, considering the time-varying relation between crude oil market and stock market, the conventional vector autoregressive method that uses fixed parameters, constant disturbance variance, and linear measurement may not be suitable for analyzing complex relations among these variables. To this end, we employ a dynamic approach- that is, a time-varying parameter vector autoregression (TVP-VAR) approach (Nakajima, 2011; Primiceri, 2005) - to explore the possible dynamic relation among the COVID-19 pandemic, the crude oil market and the stock market.
The main contribution of this paper can be summarized as follow. This work will generate fresh insights into the stock return and oil price return predictability literature. It is now well established that a range of predictors (such as financial ratios, macroeconomic indicators, terrorism) can be applied to predict returns (Mollick & Sakaki, 2019; Narayan & Sharma, 2011). However, none of the studies have considered the role of pandemics in return predictability, neither in oil nor in equity markets. Our paper is first to do so and will likely influence more work in this nascent area of research.
The rest of the paper is arranged as follows. Section 2 describes the dataset of our paper. Section 3 introduces the TVP-VAR approach and Section 4 explains the empirical results. Finally, Section 5 gives a brief summary of conclusion.
2.Data
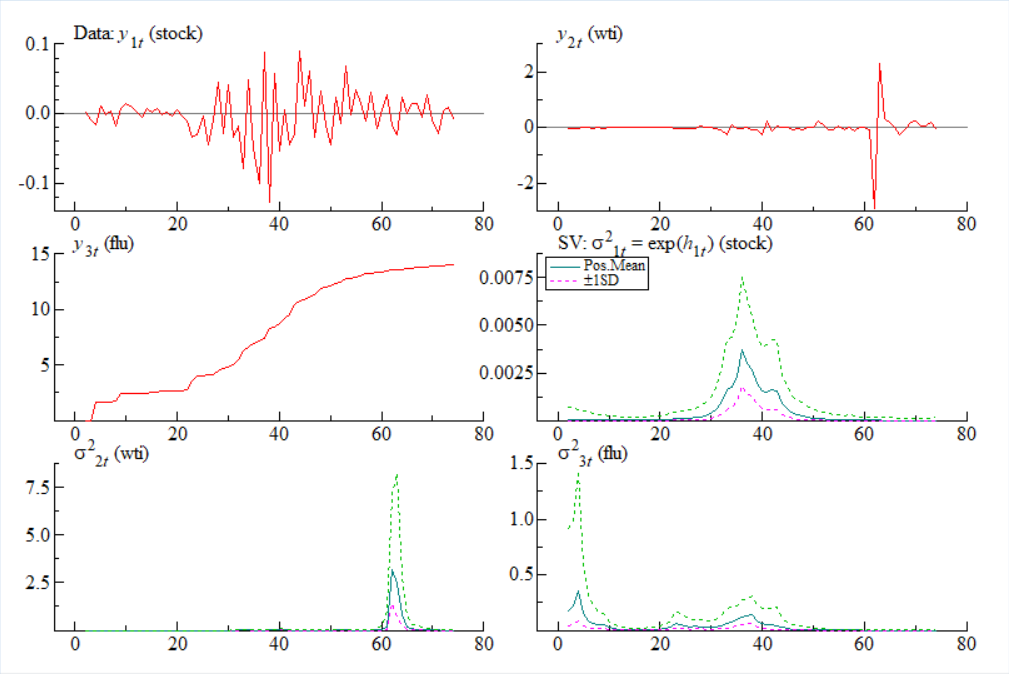
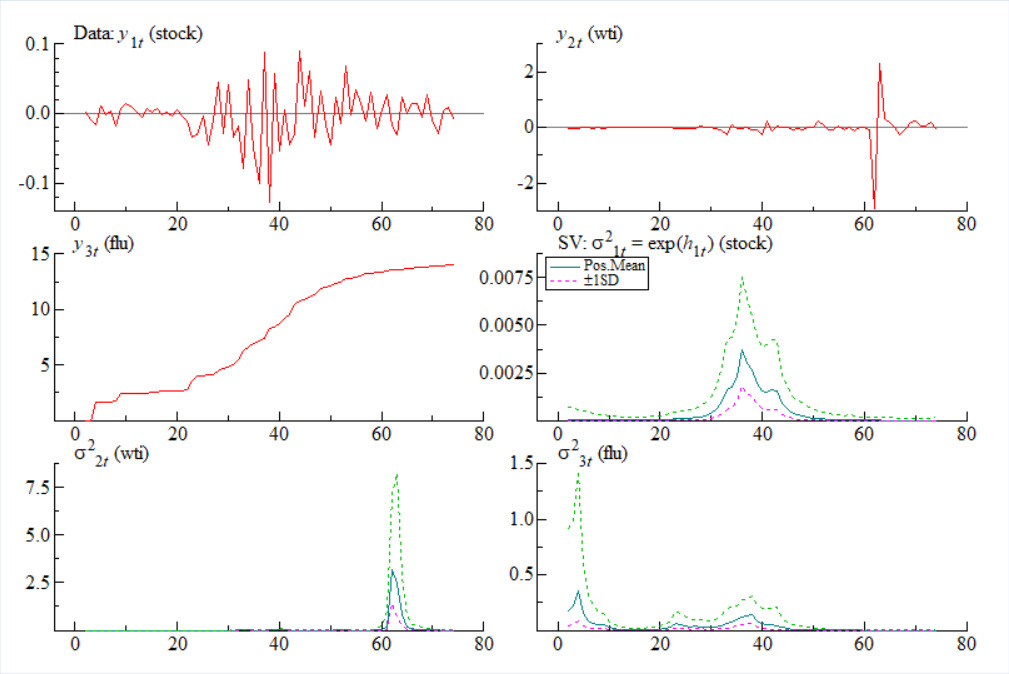
This paper collects a daily dataset consisting of three variables, namely the COVID-19 pandemic, crude oil prices, and stock prices. The time span of data is from January 21, 2020 to May 6, 2020. Specifically, these variables are proxied by the number of confirmed COVID-19 cases, the price of WTI crude oil futures, and the S&P 500 stock index. The number of confirmed COVID-19 cases is available at World Health Organization website, the price of WTI crude oil futures can be obtained from the U.S. Energy Information Administration (EIA), and the S&P 500 stock price index is from the website, https://us.spindices.com. The crude oil prices and stock prices are converted to first difference form, from its natural logarithm while the number of confirmed COVID-19 cases is converted into natural logarithm form. A new augmented Dickey–Fuller-type test for unit roots which accounts for two structural breaks is used by our paper (Narayan & Popp, 2010) and the results indicate that we can reject the unit root null hypothesis for all three variables (see Table 1).
3.Method
Our TVP - VAR model is set as follows:
yt=ct+B1tyt−1+…+Bstyt−s+et, et∼N(0,Ωt)(1)
for ,where is a 3×1 vector of observed variables, are 3×3 matrices of time-varying coefficients,and is a 3×3 time-varying covariance matrix. A recursive identification is assumed by the decomposition is a lower-triangular matrix with the diagonal elements equal to one, and Defining as the stacked row vector of is the stacked row vector of the free lower-triangular elements of and The time-varying parameters follow the random walk process:
βt+1=βt+uβt,at+1=at+uat,ht+1=ht+uht,(εtuβtuatuht)∼N(0,(IOOΣβOOOOOOOOΣaOOΣh))(2)
for ,with where and are diagonal, and Since traditional estimation methods cannot achieve consistent estimation of parameters, we adopt Bayes estimation method based on MCMC to estimate our model. Noteworthy here is that the optimal lag is selected according to various information criterion: LR, FPE, AIC, HQIC and SBIC. Their results show that first-order lag can best fit our data.
4.Empirical Results
To begin with, the parameter estimation of TVP-VAR model requires the prior value to be determined in advance. Considering our data, we assume the following a priori: , In order to calculate the posterior distribution of parameters, the MCMC algorithm was used to iterate 10,000 times, and the initial 1,000 samples were discarded.
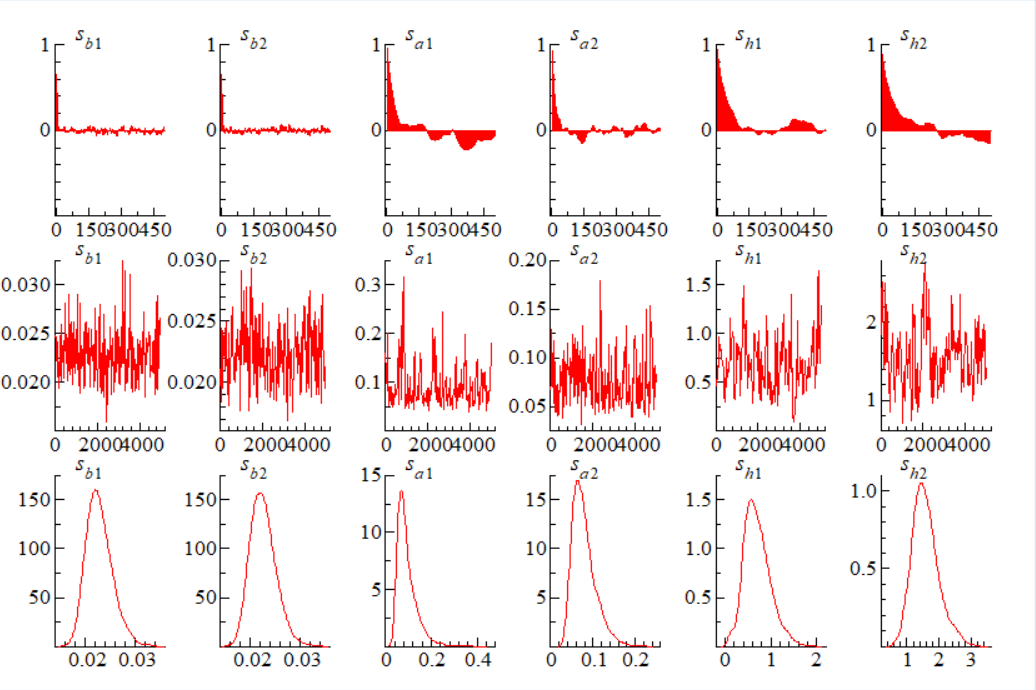
Table 2 shows the parameter estimation results of the TVP-VAR model. It can be seen that the standard deviation of each parameter is very small, and the mean values of the posterior distribution of the parameter are all within the 95% confidence interval. The probability of Geweke diagnosis is greater than 10%, indicating that the null hypothesis that the parameter converges to a posterior distribution cannot be rejected. The invalid factors are all less than 100, which can meet the sample requirements in the MCMC sampling with a total sampling frequency of 10,000 times. The estimation results show that the estimation using MCMC algorithm is effective and robust, implying that the initial setting of our model is ideal.
The sample autocorrelation coefficient and sample path of TVP-VAR model are shown in Figure 1. We can observe that the autocorrelation coefficient of the sample decreases rapidly and fluctuates around zero. The results plotted in Figure 2 also illustrate that the sample trajectory is stable. The figure presented here provides evidence for the accuracy of our results.

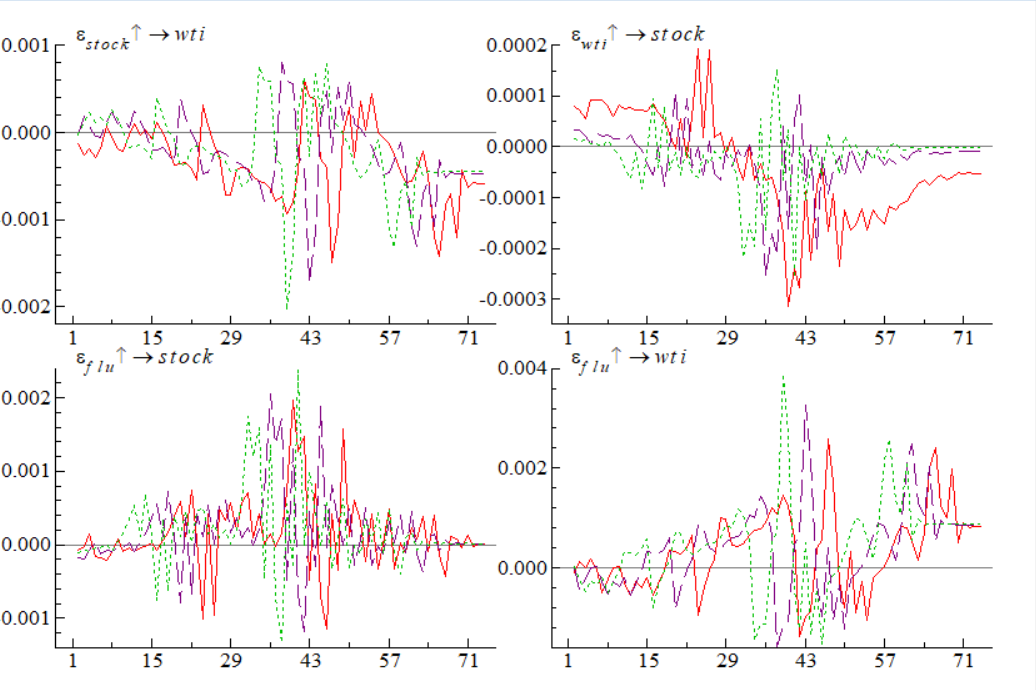
Next, we will move on to analyze the impulse response function of our model. And, in the following analysis, we observe the dynamic path of the corresponding economic variable from a change of 1% (hereinafter a unit) in the exogenous impact deviation equilibrium value. The impulse response of different period horizons reflects the time lag of the shock. Therefore, we select 4, 8 and 12 days as period horizons to represent the short, medium and long run, separately.
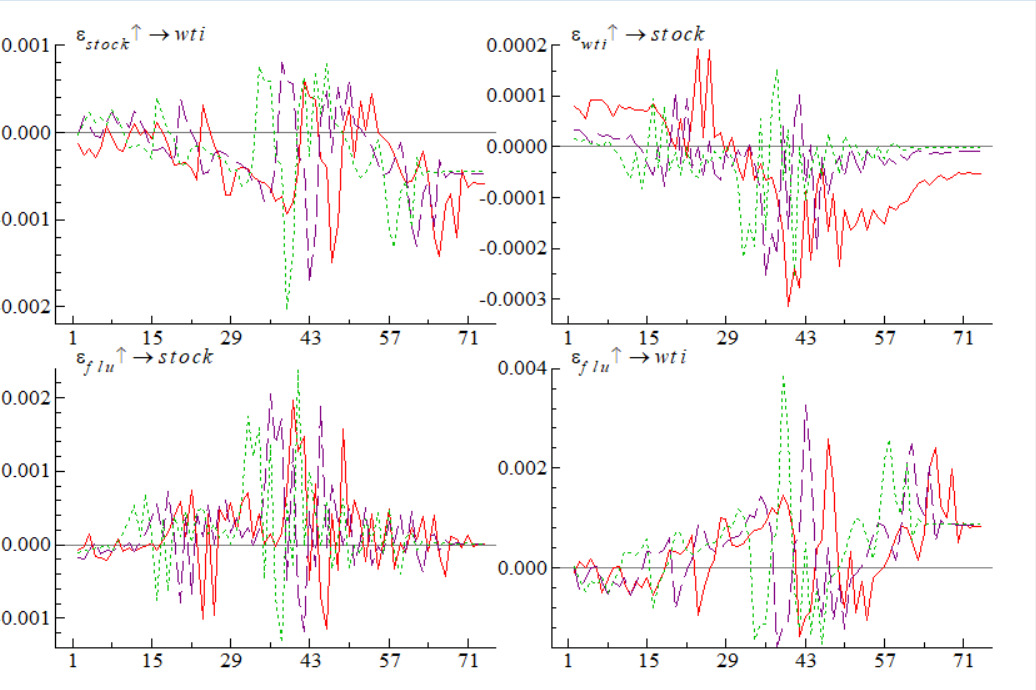
Figure 3 displays the interaction between the COVID-19 pandemic, stock returns and crude oil returns in different periods ahead. First, it is obvious that the impulse response reveals that the relation among the COVID-19 pandemic, crude oil returns and stock returns is time-varying. Second, in terms of the impulse response of crude oil returns, the effect of stock returns and epidemic can exert larger effects in long run. And the impulse response of crude oil returns to stock returns is negative whereas the impulse response of it to the pandemic is positive, which means that there is a negative association between crude oil returns and stock returns and the COVID-19 pandemic cannot exert negative impact but has a positive effect on crude oil returns. Third, with regards to the impulse response of stock returns, the crude oil returns and the epidemic can have a significantly negative and positive effect, respectively. This result discloses that there exists a negative association between crude oil returns and stock returns. Interestingly, contrary to basic economic theory, the COVID-19 pandemic cannot negatively influence the stock returns. This result may be explained by the fact that the COVID-19 pandemic leads to a higher risk premium and the investor may need more returns to compensate for the extra risk caused by the COVID-19 pandemic. This proposition needs further empirical investigation.
5.Conclusion
This study analyzed the relation among the COVID-19 pandemic, crude oil returns and stock returns in a unified framework by employing a TVP-VAR model. Our analysis can conclude following interesting conclusions. On one hand, there is a negative association between crude oil returns and stock returns in our sample period. On the other hand, contrary to intuition, the outbreak of the COVID-19 pandemic can cause significantly positive influence on the crude oil market (returns) and stock market (returns). Therefore, on the basis of our results, we can argue that the spread of COVID-19 pandemic may not damage economic performance at least for the data sample on hand. This results do not demand that governments formulate some policies to avoid the possible negative effect of the pandemic on the crude oil and stock market in the short term.
Acknowledgements
The authors are grateful to the Editor and the anonymous referees for helpful suggestions. These authors contributed equally to this study and share first authorship. Corresponding author. Professor Chien-Chiang Lee, Contact email: cclee6101@gmail.com (C.-C. Lee).