I. Introduction
When price controls are heavily practiced and applied persistently, often to keep goods and services affordable, then whether these price controls account for the market conditions, such as the ups and downs of the general movement in the prices, should be an important concern for policymakers, particularly the price regulator. This is because price controls, in general, can distort markets and cause market inefficiencies, thus negatively impacting consumer welfare. Artificially depressed prices produce shortages as individuals increase demand and firms’ capacity to increase supply diminishes (Cerda et al., 2021). Price controls on fuel can artificially increase demand and increase carbon emissions (Akimaya & Dahl, 2017). Price controls on coal, which is the main source of heating, are responsible for the increase in the concentration of air pollutants in China during autumn and winter (Lin & Ling, 2021). Price controls which become sensitive to market conditions can reduce the creation of artificial demand and the associated high costs on the firms and the environment.
In Fiji, like many other small island developing states (SIDS), petroleum products, which are fully imported, are heavily price controlled. Indeed, the regulating body, the Fiji Competition and Consumer Commission (FCCC), that commissions this in the market, orders price controls several (four) times on a regular basis within a year to allow for changes in market conditions (see Figure 1). During the COVID-19 pandemic (2020-2021), monthly price controls were commissioned.
The objective of this paper is to test whether these price control practices are at par with changes in market conditions. To this end, we test the presence, or otherwise, of a stable long run relationship between world market crude oil prices (a proxy to capture world market conditions in the crude oil market) and domestic petroleum price control orders regularly by the FCCC.
II. Research Methods
A. Data
The domestic prices are sourced from the FCCC. These are regular price control orders by the FCCC on retail prices per litre of fuel products, namely, motor spirit, diesel (or diesoline) and premix over the period (at a monthly frequency) 2011:01 to 2022:03. The price control order dates for the domestic prices of transport fuel are matched with the dates of the brent oil prices. The former prices are taken as capturing general condition in the crude oil market.
Panel A in Table 1 provides selected common statistics on the petroleum products and crude oil market prices expressed in Fiji dollars. Some observations noteworthy are as follows. First, motor spirit is, on average, most expensive at $2.24, followed by premix (FJ$2.08), diesel (FJ$1.92) and kerosene (FJ$1.58). Second, the coefficient of variation (C.V.) shows that Brent oil (oilp) is more volatile than the regulated petroleum products in Fiji. Of the petroleum products, kerosene prices have been the most volatile, ranging between FJ$0.91 to FJ$2.02. This is followed by premix, diesel and motor spirit.
In Panel B of Table 1, the Augmented Dickey-Fuller (ADF) unit root test is conducted for the series. The idea is to identify the stationarity properties of the data series—an outcome that dictates the choice of the econometric model. All series are stationary at their first differenced form, suggesting that the series are I (1) processes—that is, they contain a unit root.
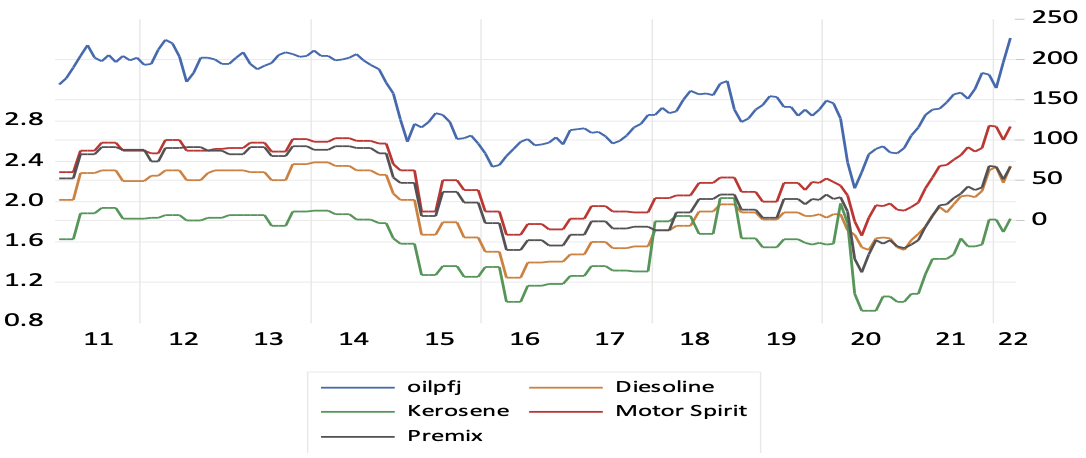
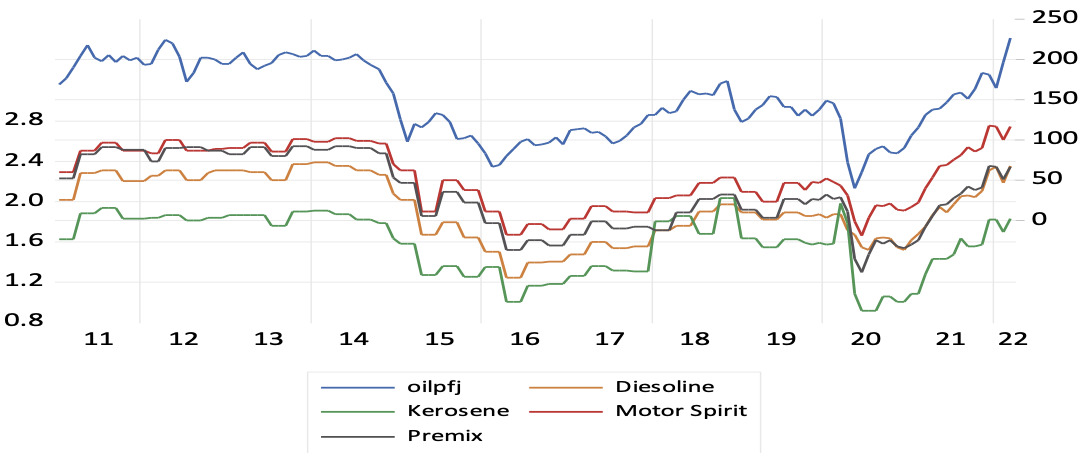
Figure 1 shows the logarithmic forms of the LOILP and the price control orders for the petroleum products in Fiji. The market conditions of crude oil prices are tracked closely by the domestic price control orders with some lags. A look at the correlation matrix of (stationary form of) the prices of petroleum products and crude oil (displayed in Table 2) suggests that there is possibly a one-period lag in the price controls to adjusting to crude market conditions. Moreover, of all the petroleum products, premix is most strongly correlated with crude oil, at 54%. Meanwhile, control prices of motor spirit and diesel are strongly correlated with that of premix (respectively at 91% and 84%), which suggests that the latter two prices are tracking premix price orders very closely.
Given that all series of interest follow I (1) processes, we proceed to examine the cointegration (or long-run) relationship between the oil price and each of the petroleum products. For this, we use the Johansen (1988, 1995) cointegration test. The Johansen approach uses the Trace and Maximum eigenvalue tests suitable for multivariate vector autoregression and allows for the possibility of endogenous relationships amongst the variables. Results reported in Table 3 suggest that premix and kerosene have a long run equilibrium relationship with the brent oil price. Furthermore, in Panel A of Table 4, where results of the error correction model (ECM) are presented, shows that the error correction term (ECT) is negative and statistically significant, which implies that the two long run equilibrium relationships are stable.
Table 4, Panel B, also reports the long run association between the cointegrated pairs found above. For both pairs, brent oil price has a positive effect, which says that in the long run, lower (higher) crude oil prices reduce (increase) Premix and Kerosene prices.
The short-run association between crude oil market conditions and the petroleum products in Fiji for the two cointegrated pairs is reported in Table 4 (see Panel A). We find that dloilp has a negative effect for both kerosene and premix, and this is significant at the 5% level for kerosene only. While kerosene and premix and the crude oil market conditions may be unsynchronous in the short-term, they tend to have a stable long run relationship as seen through the cointegration test.
We also provide stationary models for the pairs that were not cointegrated. Here, brent oil price shows a significant and a positive association with diesel and motor spirit, which indicates these prices do have the tendency to be in tuned with crude oil market in the short-term, although this is not stable over the long run.
Finally, since we noticed through the correlation matrix that Diesel and Motor spirit may be closely associated with premix, we check whether this suggests culminates into long run co-movement between the three petroleum products. Table 5 captures the Johansen test results. And all these show that a long run relationship between the petroleum products is not maintained.
III. Concluding remarks
In this note, we tested whether price-regulated (imported) petroleum products in Fiji sufficiently account for international market conditions in the long- and the short- term. To this end, we examined the cointegration relationship between the brent oil price, which depicts market conditions internationally, and the price control orders on petroleum products. Our key results are as follows. First, premix and kerosene align with crude oil market conditions well in the long-run and they adjust to market conditions in a stable manner. This may be related to the frequency of the implementation of the price controls and the forecasting capabilities of the models used. Diesel and motor spirit fail to show any cointegration link with the crude oil market or premix. High frequency of price control orders can be a costly outcome for the regulator. In such cases, adoption of models that align regulated prices to market conditions better can be useful for policymaking and for maximising both consumer and producer welfare. Future research needs to address this policy gap.