I. Introduction
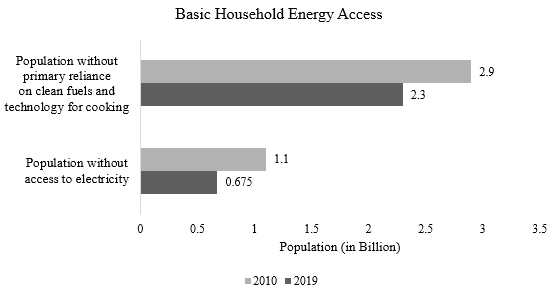
“Give light, and people will find the way,” states Ella Baker. These words symbolise support and guidance rather than referring to any energy source. Even if taken literally, the quote remains relevant, as energy is essential for our lives. Unfortunately, not everyone has access to sufficient and sustainable energy. Despite the targets of Sustainable Development Goals (SDGs) set for 2030, considerable progress is yet to be achieved (Practical Action, 2019). Statistically, according to the latest Tracking SDG7 Energy Progress Report (IEA et al., 2024), the last decade saw a decline in the proportion of the global population without access to electricity and clean cooking fuels (see Figure 1). However, ensuring essential energy accessibility remains a significant challenge for many households.

Due to the scarcity of energy resources, the concept of “energy poverty” has garnered significant attention over the past few decades (Sy & Mokaddem, 2022). Nonetheless, there remains no consensus on its definition. Various interpretations have emerged over time (Pelz et al., 2018), alongside different measurement approaches (Sy & Mokaddem, 2022).
In developed economies, where the primary issue is affordability rather than accessibility, the term “fuel poverty” is often used instead of “energy poverty” (Li et al., 2014). In these regions, fuel poverty is commonly assessed either through an economic approach or an engineering approach, focusing on deviations from the energy threshold required to meet basic needs (Pachauri et al., 2004). Conversely, in developing economies, energy poverty is typically measured in terms of access to energy sources and related services (Nussbaumer et al., 2012).
Sy and Mokaddem (2022) have comprehensively described various indicators for measuring energy poverty, expanding upon the three categories of energy metrics proposed by Bazilian et al. (2010). These categories include single indicators (e.g., Low Income/High Cost: LIHC indicator by Hills (2011)), dashboard indicators (e.g., Sustainable Development Goals), and composite indicators that comprise various multidimensional indices. Among these, composite indicators are particularly suitable for measuring household-level energy poverty, especially in developing countries.
Further, within the set of composite indicators, a widely used index is the multidimensional energy poverty index (MEPI), developed by Nussbaumer et al. (2012), hereafter denoted as MEPI (2012). Despite the development of more comprehensive indices, such as the Multi-tier Framework of Energy Access (MTF) by Bhatia & Angelou (2015), MEPI (2012) remains prevalent. There are two reasons for its continued use. Firstly, MTF and similar approaches require extensive energy surveys that are complex and costly to conduct, whereas the MEPI (2012) can be constructed using existing surveys, thus incurring no additional costs. Secondly, because the pre-existing surveys cover various socioeconomic, health, and demographic aspects, they facilitate multidisciplinary research on a range of issues.
Given the widespread use of the MEPI (2012), it is essential to evaluate whether its dimensions still accurately measure energy poverty. The MEPI (2012) focuses on primary household energy accessibility and includes indicators such as access to electricity, cooking fuel, indoor pollution, entertainment/education, appliance ownership, and communication. However, researchers have identified various gaps in the MEPI (2012) and have revised its indicators and dimensions periodically. For example, some researchers have addressed the climate dimension (Cedano et al., 2021), while others have incorporated the mobility dimension (Nawaz, 2021). This paper contributes to the literature by presenting a modified version that considers technological advancements worldwide. Furthermore, it analyzes and compares the modified MEPI with the original MEPI (2012).
II. Methodology and Results
To the best of our knowledge, Nawaz (2021) has offered the most comprehensive and updated version of the MEPI (2012). Their index incorporates indicators that address areas previously missing from the MEPI (2012), such as climate, mobility, and ICT; however, a gap remains. The index omits indoor pollution—a significant measure of energy poverty. Furthermore, simply including access to the internet does not fully define ICT non-poverty. Therefore, the index can be further refined to enhance its global applicability. The study presents both the old and the modified versions of the MEPI in Table 1.
Several indicators have been updated in the proposed MEPI. In the first dimension, while the indicator cooking fuel remains the same as in MEPI (2012), the indicator indoor pollution has been revised. Unlike the MEPI (2012), where a household was considered energy deprived if solid fuel users cooked on an open fire, stove, or chullah[1], the updated indicator now includes all unclean fuel users cooking on a polluting tool inside the house. This method is more accurate, as unclean fuels used outside the households result in lower concentrations of pollutants like particulate matter (PM2.5) or carbon monoxide (Sidhu et al., 2017).
Furthermore, to address the climate dimension, the study suggests the use of cooling or heating appliances based on the average temperature of the geographical area. The indicator other appliance access is similar to the indicator called household appliance ownership in MEPI (2012), but it extends the range of appliances by including washing machines along with refrigerators.
Lastly, a significant update to the MEPI (2012) is the inclusion of the digital access indicator, which encompasses mobile devices and computers with internet connectivity. Considering that global smartphone penetration has reached 69%, with 4.7 billion mobile internet users worldwide as of 2023 (GSMA Intelligence, 2024), the exclusion of internet-based digital communication would likely result in a biased estimation of MEPI (2012). Therefore, the study recommends incorporating a digital access indicator alongside a basic communication indicator that covers access to mobiles (without internet) or telephones. Additionally, since mobile phones or computers with internet access have become sources of entertainment comparable to television or radio, the study includes television or radio along with communication indicators within the same dimension under the entertainment access indicator.
Researchers may also consider adding a fifth dimension, mobility access. Nawaz (2021) has incorporated this dimension by using personal vehicles as an indicator of energy non-poverty. However, these vehicles run on fossil fuels, which have environmental consequences and may not represent a sustainable mobility indicator. Therefore, personal e-vehicles or public transportation could potentially serve as better indicators of mobility poverty. Nevertheless, the study does not incorporate the mobility dimension (public transport accessibility or personal e-vehicles) due to limited data availability and low penetration of personal e-vehicles (IEA, 2024).
The study then explores the differences between the proposed MEPI and the MEPI (2012). As the work is an adaptation of Nussbaumer et al. (2012), the proposed index is applicable across the globe using most national surveys, particularly the Demographic Health Survey (DHS). The exemplary analysis of India utilizes the National Family Health Survey (NFHS-5) by DHS. Data from the National Family Health Survey used in this study are publicly accessible.[2] Additionally, the study estimates MEPI*, which updates the ‘appliance ownership’ and ‘entertainment, communication, and information’ indicators, while keeping other indicators like electricity, cooking fuel, and indoor pollution the same as MEPI (2012). This modification highlights the need to update the indoor pollution indicator in MEPI (2012). The results of the analysis are presented in Table 2.
The MEPI is calculated using the same methodology as that outlined by Alkire & Foster (2011), which was also adopted by Nussbaumer et al. (2012). According to Ahmed & Gasparatos (2020), the MEPI is categorised into three poverty levels: Acute (MEPI > 0.7), Moderate (0.3 < MEPI < 0.7), and Low (MEPI < 0.3). Our findings indicate that all MEPI indices fall within the low energy poverty category. However, MEPI estimates decrease with the modification of indicators from MEPI (2012) to the proposed MEPI. The difference in values between the proposed MEPI and MEPI* (which utilises the same indoor pollution indicator as MEPI (2012)) suggests that excluding the cooking place may lead to an overestimation of MEPI.
The significance of including the cooking place is highlighted while examining the dimension-wise contribution of different MEPIs (Table 2). It is evident that the difference between MEPI* and the proposed MEPI in the Cooking dimension is attributable to the change in estimation of the indoor pollution indicator. This disparity in the estimates of the cooking dimension further widens when comparing the proposed MEPI estimates with those of MEPI (2012). Additionally, the increased share of non-cooking dimensions in the proposed MEPI indicates that MEPI (2012) does not adequately measure evolving energy poverty dimensions.
III. Conclusion
The study proposes enhancements to the MEPI (2012) and introduces a comprehensive measure of energy access. The proposed MEPI includes indicators that account for recent technological advancements, such as the increased use of energy-dependent appliances (e.g., washing machines) and sources of entertainment (e.g., smartphones, internet). This improved index aims to better inform the identification and targeting of policies.
A comparison between the estimates of MEPI (2012) and the proposed MEPI indicates that conventional measures may overestimate the incidence, intensity, and overall energy poverty. Further, dimension-wise analysis shows an increased share of modified energy indicators. This increase is attributed to the inclusion of a digital access indicator, highlighting its growing importance in the current context.
The study also identifies areas for future improvement, such as the potential inclusion of a mobility dimension to account for public transport access or personal electric vehicles. Due to the low penetration of personal electric vehicles and limited data availability on transport accessibility, this dimension was excluded for the time being. However, it suggests that future researchers can include it based on the e-vehicle penetration and data availability in their regions. Nonetheless, the proposed MEPI serves as a valuable tool for measuring universal energy access.
Chullah is a traditional Indian cooking stove made up of clay or mud.
Additional information can be found here: https://dhsprogram.com/Countries/Country-main.cfm?ctry_id=57&c=India&Country=India&cn=&r=4.
q= energy poor individuals, n= total population (refer Alkire & Foster (2011) and Nussbaumer et al. (2012) for details).
= weighted deprivation counts (censored) (refer Alkire & Foster (2011) and Nussbaumer et al. (2012) for details).