I. Introduction
Globally, environmental integration is increasingly being recognized as a significant factor in the approach of nations to growth and development. This is emphasized by the growing threat to ecological resources due to the demand from human activities (Iormom et al., 2024; Nwani et al., 2024; Ozkan et al., 2023). In the Euro-Mediterranean region, environmental practices and climate shifts are affecting the natural potential of ecosystem services. The region’s erratic weather, including droughts, heat waves, and flooding, is impacting agriculture, water resources, and livelihoods. According to Iorember et al. (2024), these conditions are increasing food insecurity and economic instability. Additionally, climatic change impacts such as desertification are contributing to the expansion of concentrated population centers (Usman et al., 2020). For example, approximately 70% of the region’s estimated 530 million people live in urban areas (United Nations, 2024).
This suggests a transition towards a highly urbanized region. Urbanization brings benefits, including the development of industrial centers and increased adoption of digital systems intended to enhance efficiency in production and service delivery. This expansion is necessary to meet the high demand imposed by concentrated urban populations while maintaining environmental integration. However, current literature on environmental integration in the region has not fully captured these dynamics. Additionally, some experts argue that urbanization can lead to large-scale environmental degradation, with digital system adoption contributing to electronic waste generation (Bature et al., 2020; Zhou et al., 2020). Nevertheless, the Green IT thesis and the digital sustainability theory provide a framework suggesting that information technology adoption can lead to environmental benefits by minimizing resource consumption, optimizing energy use, and reducing pollution (Iorember et al., 2022). Overall, these theories highlight the interconnectedness of technology and the environment and aim to promote sustainable practices and technologies in the IT industry to mitigate environmental harm and contribute to an eco-friendlier future.
This paper aims to investigate the complex relationship between urbanization, digital system adoption, and environmental integration among Euro-Mediterranean countries. This region represents an excellent case study for analyzing this interaction due to its distinctive environmental challenges, rapidly urbanizing populations, and strong commitment to technology and innovation. By exploring how these factors interact, the study makes a significant contribution to the ongoing discourse on the potential of Green IT to foster environmental sustainability. Importantly, this research employs the load capacity factor as a measure of environmental integration. This proxy provides a more comprehensive assessment of ecological impacts compared to other analyses that use metrics such as carbon emissions and ecological footprint.
Recent studies focusing on environmental integration, using load capacity factor as a proxy, have gathered significant attention. For example, research by Xu et al. (2022) indicates that economic growth and both renewable and non-renewable energy reduce the load capacity factor, while urbanization has an insignificant effect. Additionally, Qayyum et al. (2024) found that information and communication technology (ICT) and institutional quality positively influence environmental sustainability by enhancing ecological quality. Pata and Samour (2022) examined the impact of nuclear and renewable energy on the ecological footprint, carbon (CO2) emissions, and load capacity factor. Their results suggest that nuclear energy reduces CO2 emissions and increases the load capacity factor. Similarly, Pata and Balsalobre-Lorente (2022) discovered that tourist arrivals, energy consumption, and economic growth have a long-term negative impact on the load capacity factor.
The paper is structured as follows: Section II covers the methodology, Section III discusses the results, and the final section concludes the study.
II. Methodology
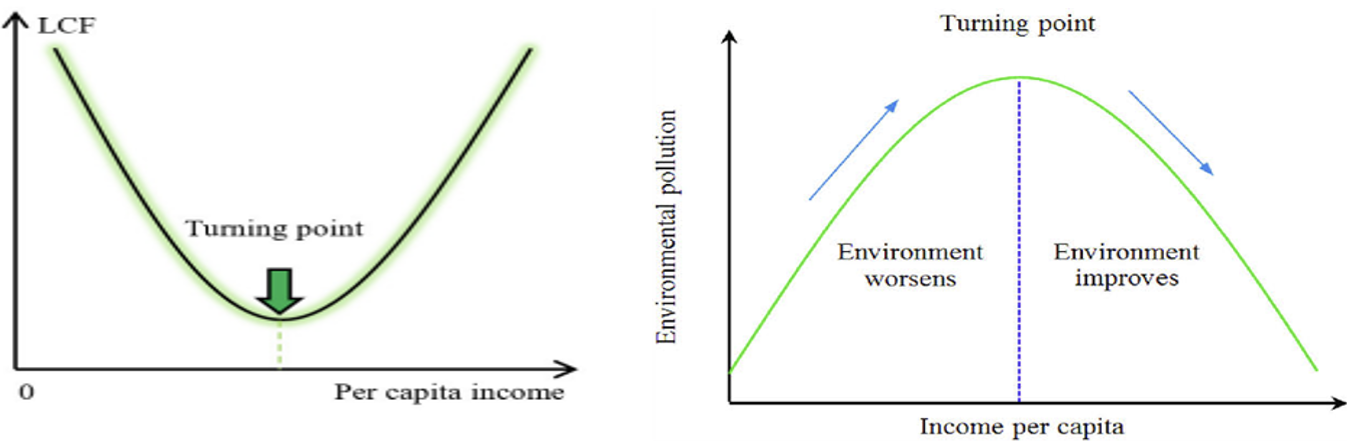
This investigation utilizes panel data from 23 Euro-Mediterranean countries/cross-sections (Albania, Bosnia and Herzegovina, Algeria, Morocco, France, Croatia, Montenegro, Cyprus, North Cyprus Turkish Republic, Libya, Lebanon, Egypt, Malta, Monaco, Slovenia, Syria, Tunisia, Turkey, Vatican City, Greece, Spain, Israel, Italy) spanning the years 2000 to 2019. The Load Capacity Factor (LCF) is employed as an indicator of environmental integration. LCF is calculated as the ratio of biocapacity to the ecological footprint, providing a comprehensive measure of the overall demand for ecological resources in relation to their supply. Contrary to the Environmental Kuznets Curve, which illustrates an inverted U-shape, the load capacity curve hypothesis is graphically depicted as a perfect U-shape. This suggests that environmental security deteriorates at lower levels of economic growth and improves beyond a certain income threshold, enhancing environmental sustainability. This relationship is illustrated in Figure 1.

The primary independent variables are urbanization (URB), measured as the urban population percentage of the total population, and digital systems adoption (DSA), defined by a metric that includes mobile telephone, fixed line telephone, and internet subscription, obtained using principal component analysis. The study controls for income per capita, measured as per capita GDP in dollars, and trade openness (TO), which corresponds to the share of trade to GDP. Data on LCF are sourced from the Global Footprint Network. For all the independent variables, the data are obtained from the World Development Indicators and expressed in logarithmic terms. The functional model is represented as:
LCFit=f(GDPit, GDP2it, URBit, DSAit, TOit)
The exact form of the CS-ARDL model is as follows:
ΔLCFi,t=αi+p∑j=1βijΔLCFi,t−j+q1∑k=0δikΔGDPi,t−k+q2∑k=0δ2kΔGDP2i,t−k+q3∑k=0δ3kΔURBi,t−k+q4∑k=0δ4kΔDSAi,t−k+q5∑k=0δ5kΔTOi,t−k+γiECTi,t−1+ϵi,t
where is the first difference of the dependent variable for cross-sectional unit i at time t. represents the intercept for each cross-sectional unit (country). and are the first differences of the independent variables with their respective lags. denotes the optimal lag of the dependent variable (LCF), while and represent the optimal lags for the independent variables respectively. is the coefficient of the error correction term indicating the speed of adjustment to long-run equilibrium, is the error correction term, and is the error term.
The C-S ARDL model is an improved panel data approach for estimating the dynamic common correlated effects (Iorember et al., 2022). The optimal lag structure is determined using the Akaike Information Criterion (AIC), which penalizes overparameterization and balances complexity and model fit.
III. Results and Discussion
A. Preliminary analysis
The investigation starts with a preliminary analysis that includes examining cross-sectional dependence and the unit root properties of the variables used in the study. The choice of the appropriate panel unit root test is based on the results of the Cross-sectional Dependence (CD) test, for which this study uses the Pesaran CD procedure[1]. Moreover, the study employs the Pesaran (2007) cross-sectional augmented Dickey Fuller (CADF) and the cross-sectional Im, Pesaran, and Shin (CIPS) panel unit root tests.
The results of the cross-sectional dependence using the Pesaran (2015; 2004) procedure are shown in Table 2. These results indicate a rejection of the null hypothesis of cross-sectional independence for all the variables at the 1% level of significance, suggesting that a shock in one of the Euro-Mediterranean countries is transferred to other members. Consequently, two cross-sectionally augmented unit root methods were employed to assess the stationarity of the series.
Based on the results of the CD tests, this study employs the Cross-Sectional Augmented Dickey-Fuller (CADF) and Cross-Sectional Im, Pesaran, and Shin (CIPS) unit root tests as proposed by Pesaran (2007) to verify the unit root properties of the series. Both methodologies offer robust estimates and reliable inference in the context of cross-sectional dependence and heterogeneity. The findings clearly indicate that all variables achieved stationarity upon taking the first difference, as evidenced by their strong significance (P<1%).
III. Main Findings
Table 3 presents the results of the CS-ARDL analysis, which serves as the primary model for this study. The analysis indicates that economic activities have contributed to enhancing environmental sustainability over the study period in the Euro-Mediterranean region. Specifically, a 1% increase in economic expansion results in an 8.4% decrease in environmental sustainability, as measured by load factor capacity. This finding aligns with the research by Usman et al. (2020) for Brazil and Ozkan et al. (2023) for China.
However, the study also reveals that an increase in GDP2, representing economic prosperity, improves environmental quality once a certain threshold is reached, as evidenced by the positive and statistically significant coefficient of GDP2 in the long run. A 1% increase in GDP2 leads to a 0.45% increase in LCF, thereby validating the load capacity curve hypothesis. Furthermore, the results indicate that urbanization negatively impacts LCF in the short term, which contrasts with the findings of Xu et al. (2022). Nonetheless, our analysis identifies a positive and statistically significant relationship between urbanization and LCF, consistent with Raihan et al. (2023) for Mexico.
Regarding the impact of digitalization, a negative coefficient is noted in both the short- and long-run, indicating that digital adoption may lead to a decrease in environmental quality. However, this effect is statistically significant only in the short run. Additionally, it is found that trade openness raises the LCF in both the long- and short-run. A 1% increase in trade openness corresponds with an approximately 2.11% increase in LCF in the long run, differing from Alola et al (2023) who found a negative effect of trade on the LCF. The coefficient of the estimated error correction term is -0.825 and highly statistically significant, suggesting that short-run disequilibrium is corrected, and the variables converge to the long-run equilibrium at a rate of 82.5%.
IV. Conclusion
This study underscores the critical need for adopting sustainable practices in response to rapid urbanization and digitalization. The findings urge policymakers, industry stakeholders, and researchers to collaboratively develop strategies that mitigate the negative environmental impacts of urban transition and digital adoption, while also leveraging the benefits of urban development and technological advancement. By considering the U-shaped relationship between GDP and environmental sustainability, along with the limitations of Green IT theory, future initiatives can more effectively address the complex challenges faced by the Euro-Mediterranean region and foster a more sustainable future.
The Pesaran CD test uses the Pesaran (2015; 2004) test statistic.