
I. Introduction
The first goal of Sustainable Development Goal (SDG) 8 is to achieve at least 7% annual GDP growth in least developed nations. Though many African countries have shown GDP growth recently, Nigeria, Africa’s largest economy with abundant crude oil, continues to experience low GDP growth (World Development Indicators, (WDI) 2023). This might hinder per capita economic growth and obstruct achieving SDG 1 by 2030, as per capita economic growth is linked to poverty reduction (Agrawal, 2008). Currently, 40% of Nigeria’s population lives below the national poverty line, and about 63% are multidimensionally poor (WDI, 2023).
The question is: why is Nigeria recording low GDP growth despite its crude oil wealth? There could be various reasons, but according to the paradox of plenty (see Sachs & Warner, 1999; Singh et al., 2024), the country might be experiencing reduced benefits from its abundant natural resources and thus shows a low GDP growth rate. For example, the production of raw natural resources, such as crude oil, can pollute the environment and disrupt economic activity. During fossil fuel drilling and extraction, greenhouse gases are released into the atmosphere, potentially leading to climate change-induced natural disasters like landslides, floods, droughts, and river erosion (see Liu et al., 2022) that may impact economic activity. Additionally, emissions from crude oil production pose significant health concerns. For instance, Polycyclic Aromatic Hydrocarbons released during crude oil production can persist in the environment and have carcinogenic effects on humans (see Orisakwe, 2021). Toxic hydrocarbon fumes, such as toluene, benzene, xylene, and ethylbenzene, negatively affect air quality, which may impair human health, decrease life expectancy, slow down economic activity, and disrupt SDG 1, SDG 3, SDG 8, and SDG 13.
In this context, this study investigates the impact of crude oil production on GDP growth in Nigeria. This is particularly pertinent for the country, which has recently prioritized increased crude oil production as a key policy goal in its national petroleum policy framework (see KPMG, 2017). If crude oil production negatively affects GDP growth, it is imperative for Nigeria to consider adopting diversified economic policies; otherwise, GDP growth may decelerate, jeopardizing the United Nations’ 2030 sustainable development targets within the country.
Unlike existing studies that have concentrated solely on aggregate GDP (Singh et al., 2024; Zhou et al., 2023), this research utilizes GDP by sector to avoid the bias associated with using aggregate GDP. A significant limitation of aggregate GDP is that it fails to distinguish the performance of different sectors within an economy rich in natural resources. This distinction is crucial, as evidence suggests that natural resource abundance can affect the performance of resource and non-resource sectors differently (see Sachs & Warner, 1999), which may not be detected when using aggregate GDP that combines GDP from both sectors.
Furthermore, previous studies on the effect of crude oil production on GDP have often assumed constant parameters over time. However, there may be parameter instability due to the dynamic nature of crude oil production influenced by crude oil price shocks. Thus, this study considers the possibility of parameter instability.
The rest of the paper is structured as follows. The analytical techniques and data are discussed in Section II. The empirical findings are presented in Section III, while Section IV concludes the study.
II. Methodology
This study is based on Stiglitz’s (1974) neoclassical growth model that includes exhaustible natural resources. The central idea is that natural resources can impact growth (Maris & Holmes, 2023). The model uses a Cobb-Douglas production function with land and other natural resources as additional inputs.
\[Y = K^{\alpha}L^{\beta}L_{a}^{\varepsilon}R^{\delta} \ni \alpha + \beta + \varepsilon + \delta = 1 \tag{1}\]
Here, Y denotes GDP, K represents capital, L stands for labour, La indicates land, and R refers to other natural resources. Based on the theoretical model and previous studies, we define an econometric model that includes GDP and natural resources. Given our focus on crude oil production, we specifically interpret natural resources as crude oil production in this context.
\[Y = ҩ + \zeta{COP}_{t} + Ϛ{LAB}_{t} + ϛ{CAP}_{t} + \varepsilon_{t} \tag{2}\]
Where COP represents crude oil production, LAB is labour, CAP is capital, and ε is the error term. Tables 1 and 2 show the measurement and characteristics of these variables.
The study used the Bayesian time varying coefficients VAR (BTVCVAR) technique to estimate Equation (2). Unlike previous methods, BTVCVAR captures changes in crude oil production over different periods, including surges and declines due to price shifts. BTVCVAR combines TVCVAR with a prior distribution, which incorporates existing information about the subject before using the dataset. The model is typically reduced, with estimates pulled towards this center when the prior is tightened. Thus, the prior is written as:
\[\pi\left( b_{0},\ S,\ q \right) = \ \pi\left( b_{0} \right)\ \pi(S)\ \pi(q)\tag{3}\]
where
\[\begin{array}{c} b_0 \sim N(b_0, B_0)\\ Տ \sim IW(S, s)\\ q \sim IW(q, Q) \end{array}\]
The prior distribution and likelihood function, estimated via Markov chain Monte Carlo (MCMC), combine to form a posterior distribution, which is used for inference and predictions. Given a dataset d and coefficient set δ, including δ_0, the posterior distribution in a model with unknowns δ, Տ, and q_ is given by Equation (4) and simulated using the Gibbs sampler.
\[П\left( \delta,Տ,q \middle| d \right)\infty\ П\left( \delta_{0},Տ,q \right)\prod_{t = 1}^{T}{f(}d_{t}\left| \delta_{t},Տ \right)f\left( \delta_{t} \middle| \delta_{t - 1},q \right)\tag{4}\]
To ensure credible posterior inference, inefficiency factors are checked with where is the sample autocorrelation at lag 1. Using the BTVCVAR technique, Equation (2) is then transformed as follows:
\[\mathrm{\Upsilon}_{t} = ϰ_{t}Ҩ_{t} + \varphi_{t}^{- 1}\sum_{t} \varepsilon_{t}, t = l + 1,\ldots, n \tag{5}\]
where the coefficient, is time-varying, and are square matrices of time-varying coefficients. is a k X 1 vector of observed variables. If we allow a stacked vector in the lower-triangular elements of and the parameter in Equation (5) takes a random walk process:
\[Ҩ_{t + 1} = Ҩ_{t} + \upsilon_{Ҩt}, \tag{6}\]
\[ϫ_{t + 1} = ϫ_{t} + \upsilon_{ϫt}, \tag{7}\]
\[Ϧ_{t + 1} = Ϧ_{t} + \upsilon_{Ϧt,} \tag{8}\]
\[\begin{pmatrix} \varepsilon_{t} \\ \upsilon_{Ҩt} \\ \upsilon_{ϫt}\ \\ \upsilon_{Ϧt} \end{pmatrix} \sim N \left( 0,\begin{pmatrix} 1 & 0 & 0 & 0 \\ 0 & \Sigma_{Ҩ} & 0 & 0 \\ 0 & 0 & \Sigma_{ϫ} & 0 \\ 0 & 0 & 0 & \Sigma_{Ϧ} \end{pmatrix} \right)\tag{9}\]
for The random walk process’s drifting coefficients capture potential changes or structural breaks over time.
III. Results and Discussion
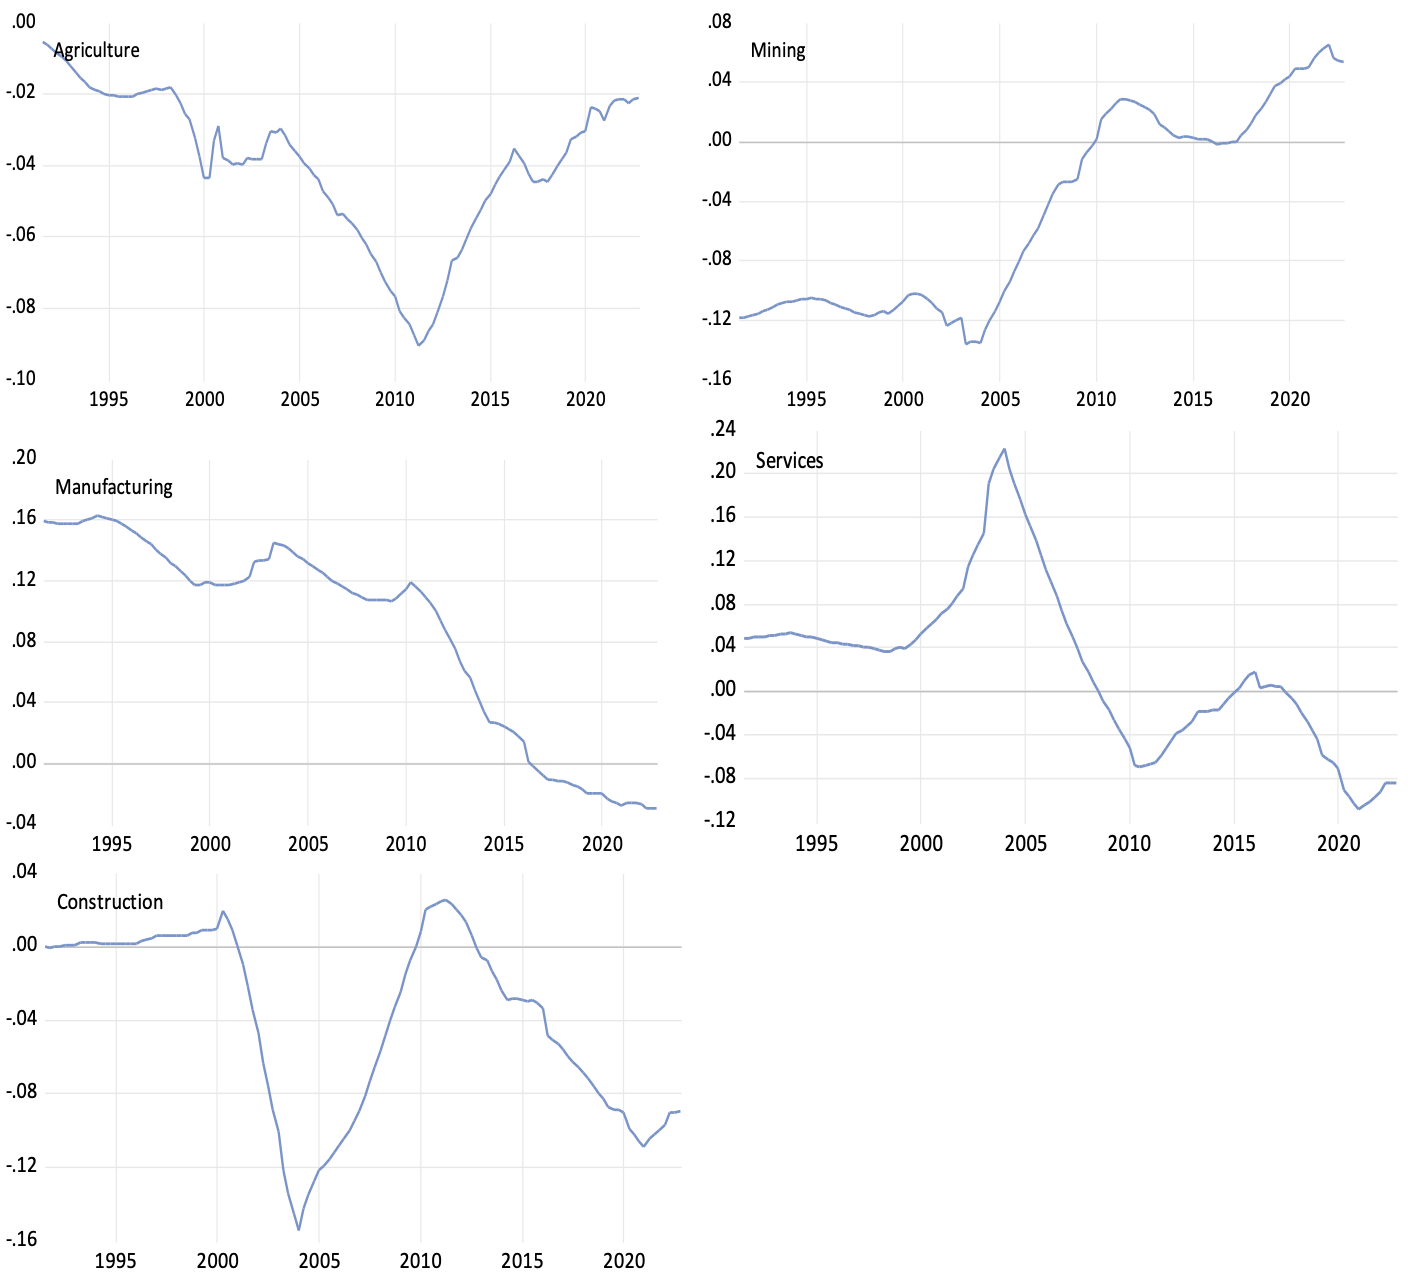
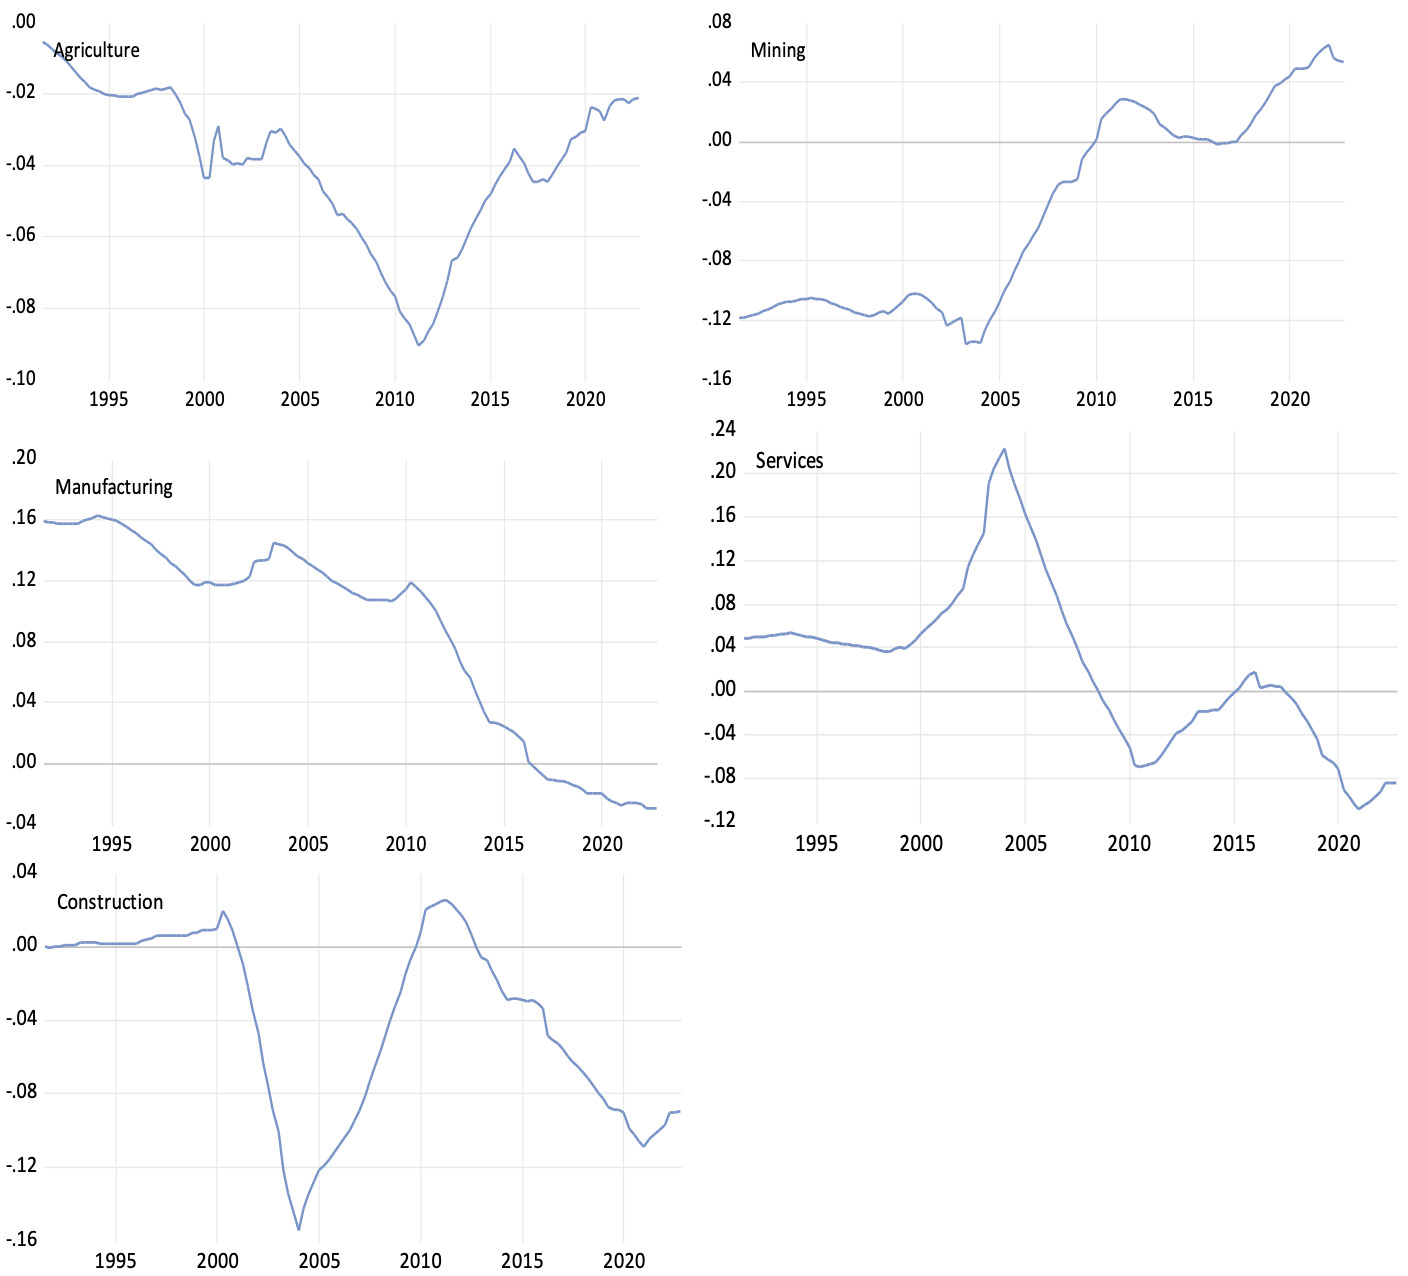
The study used the Chow test to check for parameter instability in Equation (2), with results in Table 3. The significant F-statistics suggest parameter instability across all estimated VARs, supporting the choice of technique. The BTVCVAR estimation results, shown in Figure 1, reveal time-varying coefficients. Specifically, the impact of crude oil production on GDP growth across sectors fluctuates significantly between positive and negative over time.
The effects were found to be unstable throughout the study period, which contradicts the claims in existing studies, including Zhou et al. (2023), that the impact of crude oil production on aggregate GDP is positive and constant over the years. The Figure also shows that, in recent years, crude oil production has negatively impacted GDP growth in the agricultural, construction, manufacturing, and services sectors. However, the effects of crude oil production on GDP growth in the mining sector in recent years remain positive.
Furthermore, Table 3 displays the characteristics of the estimated BTVCVAR model. The mean and standard deviation (SD) of each parameter are low, and the mean values fall within the 95 percent confidence interval. The inefficiency factors (IF) are also low (less than 100), demonstrating efficient sampling for the parameters in the BTVCVAR model. Additionally, this indicates that more than 100 uncorrelated samples have been estimated by the MCMC, which is sufficient for posterior inference.
Moreover, Figure A (see Appendix) illustrates the responses of GDP growth by sector to a positive shock in crude oil production. Although this Figure represents the last three months of the sample period (2023Q4), similar patterns were observed throughout the entire sample period. The Figure suggests that a positive shock in crude oil production will lead to a decline in GDP growth in the agricultural, construction, manufacturing, and services sectors. Nevertheless, GDP growth in the mining sector responded positively to a positive shock in crude oil production.
IV. Conclusion
This study makes a significant contribution to the literature by investigating the impact of crude oil production on sectoral GDP growth. Utilizing the BTVCVAR model, the study accounts for dynamics in crude oil production induced by crude oil price fluctuations, a factor often overlooked in previous research. The findings indicate that the impact of crude oil production is markedly time-variant. Specifically, recent data suggests that crude oil production has negatively affected growth in the agricultural, construction, manufacturing, and services sectors, corroborating the paradox of plenty (see Sachs & Warner, 1999). Conversely, the study observes that crude oil production has recently fostered GDP growth in the mining sector.
Based on these empirical results, the study recommends that the Nigerian government and policymakers adopt measures to curtail crude oil production within the country and pursue diversified economic policies that may yield better outcomes than a sole reliance on crude oil production. Alternatively, policies promoting carbon capture and storage—which are currently inadequate amid increasing crude oil production—should be implemented. Without such measures, the objective of leveraging crude oil resources for economic growth may remain unattainable.
