I. Introduction
The transition to green investments has gained increasing attention in recent years from environmentally conscious investors. This shift is driven by the urgent need to address environmental issues exacerbated by economic growth, which increases CO2 emissions and aggravates climate change (Yousfi et al., 2023). Environmental or sustainable finance aims to facilitate the smooth transition to a decarbonized economy. Financing green projects and investing in green assets help mitigate environmental degradation and promote sustainability. Green bonds, clean energy markets, and green equity markets are widely recognized as environmental assets that reduce environmental pollution (Cao, 2023; Wan et al., 2022; F. Wang et al., 2021; M. X. Wang et al., 2018). Tiwari et al. (2023) indicate that green equities are shares of companies that improve the environment. Glomsrod & Wei (2018) indicate that green bonds reduce the consumption of dirty energies and therefore reduce global CO2 emissions.
As the world grapples with the escalating impacts of climate change, the quest for sustainable solutions has never been more critical. Green finance emerges as a beacon of hope, promising to channel resources towards sustainable projects that can curb pollution and foster a sustainable future. Therefore, this study delves into the potential environmental benefits of green investments, exploring how green bonds, clean energy markets, and green equities can act as powerful tools in reducing carbon footprints. To achieve this objective, our study uses quantile-on-quantile regression to identify the heterogeneous and asymmetric linkage between various green finance assets and global CO2 emissions across different quantiles. By investigating the dependence structure between green finance and CO2 emissions, we aim to uncover insights that will empower investors, policymakers, and corporations to mitigate environmental issues and promote sustainability.
In Sections II, III, and IV, we discuss the methodology and data, empirical results, and the conclusion, respectively.
II. Methodology and Data
This study employs the quantile-on-quantile (QQ) model of Sim & Zhou (2015) to investigate the asymmetric and heterogeneous relationships between CO2 emissions and green finance assets across various conditional distributions. The nonparametric quantile regression (QR) model is defined as follows:
CO2t=βθ(GFt)+μθt
where is the CO2 fluctuation in period t and denotes green finance indices in period t; is the th quantile of the conditional distribution of CO2, and is a quantile error whose conditional th quantile is equal to 0. The (.) is an unknown function, and at this level, we do not have a prior idea about the nexus between assets.
However, the dependence between the th quantile of CO2 and the th quantile of green finance indices with being an unknown function in QR with first-order Taylor expansion around the quantile is given as:
βθ(GFt)≈βθ(GFϑ)+βθ′(GFϑ)(GFt−GFϑ)
where represents the partial derivative of and can be defined as and respectively, as indicated by Sim & Zhou (2015). We can rewrite Equation (2) as follows:
βθ(GFt)≈β0(θ,ϑ)+β1(θ,ϑ)(GFt−GFϑ)
If we substitute Equation (3) into a standard QR, as shown in Equation (1), we obtain the following equation:
CO2t=β0(θ,ϑ)+β1(θ,ϑ)(GFt−GFϑ)+μθt
Nevertheless, we need to weight the observations in the neighborhood of As we know, the quantile-on-quantile model is nonparametric and requires bandwidth selection.
This paper considers global CO2 emissions as a proxy measure for environmental degradation. For green finance assets, we utilize the S&P Global Green Bond Index and eight energy and non-energy green equity market indices, namely energy efficiency, fuel cells, green buildings, green transportation, pollution mitigation, green solar energy, green water energy, and green wind energy equity markets. Global CO2 emissions data are obtained from https://www.co2.earth, while the green bond data are sourced from https://www.spglobal.com. The green stock market data are collected from https://www.investing.com. The sample period consists of weekly data sets from January 2014 to December 2023. We transform all variables into logarithmic first differences. Table 1 presents the descriptive statistics of the variables. The descriptive statistics show that the means of carbon dioxide emissions and green equity are positive, while the mean is negative for the green bond. However, the Jarque-Bera test of normality indicates that all variables under study do not follow a normal distribution.
III. Empirical Results
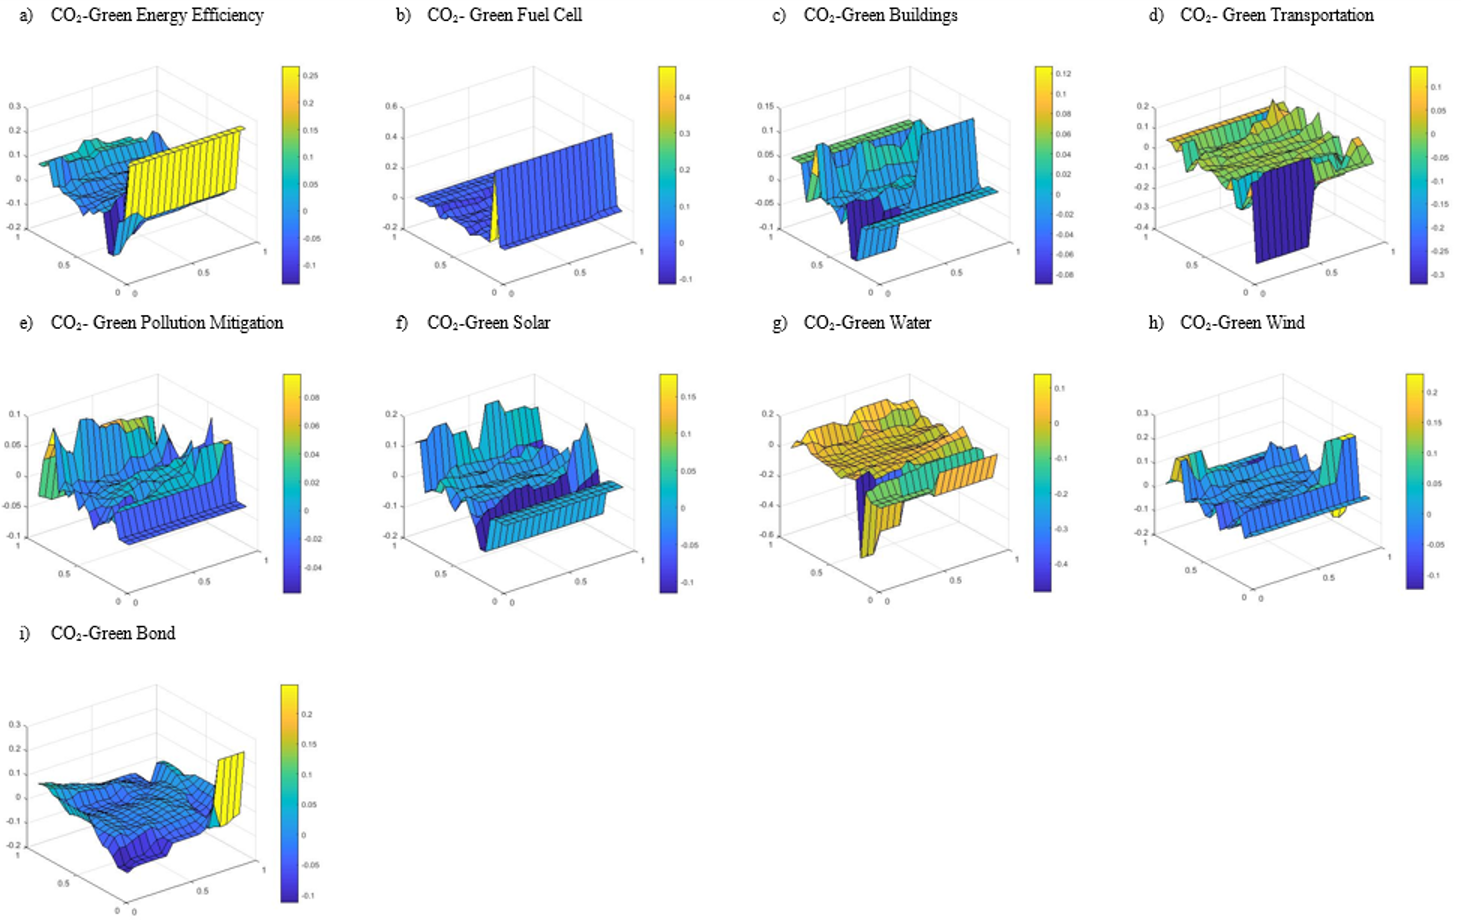
This study employs a quantile-on-quantile model to investigate the relationship between green investments and CO2 emissions, revealing complex connections across different levels of CO2 emissions and market conditions. The QQ dependence results, illustrated in Figure 1a-i, highlight both positive and negative linkages that vary depending on the quantiles of the variables under investigation. When examining the relationship between energy efficiency stocks and CO2 emissions, a strong negative linkage is observed at lower quantiles (0.2–0.4). However, this relationship weakens across middle to higher quantiles of CO2 (0.5 to 0.8) and energy efficiency equity (0.5 to 0.95). Conversely, a positive relationship emerges when CO2 emissions are in the lower quantiles (0.05–0.2) across various regimes of energy efficiency (0.05 to 0.95). Additionally, another positive linkage is noted between higher CO2 regimes and the lower to upper regimes of the energy efficiency index (0.05 to 0.8).

Moreover, the relationship between CO2 emissions and the green fuel cell index also exhibits significant variation. A strong negative linkage is found across the middle to upper quantiles of CO2 (0.5 to 0.7) and various quantile ranges of the fuel cell index (0.05 to 0.95). Similar to energy efficiency stocks, a positive linkage exists between lower quantiles of CO2 and lower to higher quantiles of the fuel cell index (0.05 to 0.95). Weak relationships are observed at higher CO2 quantiles (0.7–0.95) across various quantile ranges of fuel cell equity. Analyzing the connection between CO2 emissions and green building equity reveals an overall weak dependence. There is a strong negative dependence at lower quantiles of CO2 (0.1 to 0.3) and the green buildings index (0.05 to 0.4). In contrast, a positive linkage appears at higher CO2 regimes (0.7–0.95) across all quantiles of the green buildings index.
Nonetheless, the relationship between CO2 emissions and green transportation stocks is generally weak across all quantiles. However, a strong negative linkage emerges at extremely low CO2 quantiles (0.1) and lower to middle quantiles of green transportation (0.05 to 0.5). Positive dependence is noted at the extreme high regime of green transportation (0.95) and lower CO2 regimes, as well as when CO2 is high (0.8–0.95) across various quantiles of the green transportation index. In the case of the green pollution mitigation index, a strong negative relationship is found when CO2 is low (0.05–0.2) across all quantiles of the index. Middle quantiles of CO2 emissions (0.4 to 0.6) also show a negative linkage with lower quantiles (0.05 to 0.3) and middle quantiles (0.5–0.6) of the green index. Strong positive dependence appears at lower CO2 quantiles and extreme quantiles of pollution mitigation equity, as well as at upper CO2 regimes (0.8–0.9) across various quantiles of pollution mitigation equity (0.05–0.95).
Additionally, the green solar index exhibits a generally weak relationship with CO2 emissions across various quantiles. Nonetheless, a strong negative association is found when CO2 is low (0.2-0.3) across different quantiles of green solar equity (0.05 to 0.95). Another significant negative dependence exists at higher quantiles of both CO2 (0.8) and the solar index (0.7 to 0.95). Conversely, a strong positive link is observed between higher solar stock quantiles (0.7 to 0.95) and lower CO2 quantiles (0.3), as well as when CO2 emissions are high (0.9) across different quantiles of the green asset (0.05 to 0.95). The green water index, once again, displays mixed dependence on CO2 emissions. A negative association is present at lower quantiles of both assets (CO2 at 0.2–0.3 and water stock at 0.05–0.4). In contrast, a positive linkage is confirmed between middle to upper quantiles of both variables (CO2 at 0.4 to 0.9 and water energy index at 0.05 to 0.95). Other quantile linkages exhibit weaker relationships.
Meanwhile, the green wind energy index shows a strong negative linkage with CO2 emissions in the upper quantile ranges of CO2 (0.8) and green wind stock (0.7 to 0.95). Conversely, a positive relationship emerges when CO2 is low (0.2 quantile) and the wind energy index is high (0.7 to 0.95 quantiles). At the upper regime of CO2 (0.9) and lower regimes of the wind energy index (0.05–0.3), the green asset is positively linked to environmental degradation measures. Lastly, the relationship between global green bonds and CO2 emissions also exhibits a strong negative association when both are at low quantiles (0.05 to 0.2 for CO2 and 0.05 to 0.4 for green bonds). A strong positive linkage is found between higher green bond quantiles (0.8 to 0.95) and extremely lower CO2 quantiles. The remaining quantiles show weaker linkages between both assets.
Overall, the relationship between global carbon emissions and green finance instruments reveals significant findings. We observe a strong linkage between green finance and environmental degradation, which varies across quantiles. Specifically, there is a negative relationship when CO2 emissions are lower (lower quantiles), regardless of the quantile ranges of green instruments (from lower to higher quantiles). This finding suggests that both green equities and green bonds contribute to the reduction of carbon dioxide emissions. Furthermore, in most cases, we observe a positive association across higher quantiles of CO2 emissions and different quantile ranges of various green index regimes (i.e., bearish, normal, and bullish regimes). This finding suggests that an increase in global CO2 emissions corresponds to an increase in the demand for green financial instruments. Conversely, the negative linkage across lower quantiles of CO2 emissions and higher quantiles of green finance assets confirms the asymmetric relationship between CO2 emissions and green assets. Our results are consistent with findings from Meo & Karim (2022), Wang et al. (2018), and Wang et al. (2021). We support the notion that green investment assets provide practical benefits for addressing environmental issues.
The study’s findings have profound implications for various stakeholders. For instance, policymakers can use these insights to craft effective environmental regulations and incentives for green investments, promoting sustainability goals. Moreover, investors gain a dual advantage from green financial assets, which not only help reduce CO2 emissions but also present lucrative market opportunities as demand grows. Financial institutions can expand their green product offerings to attract eco-conscious investors. Additionally, corporations can integrate green finance into their sustainability strategies to manage risks and enhance their appeal.
IV. Conclusion
This study aims to investigate the relationship between green equities, green bonds, and global CO2 emissions across various conditional distributions using quantile-on-quantile regression. Our analysis confirms that green assets exhibit both negative and positive correlations with carbon dioxide emissions, indicating asymmetric connectivity based on quantile linkage. We find that eco-friendly assets reduce CO2 emissions, reflecting an inverse relationship with green assets during bearish or bullish market conditions and lower quantiles of CO2. Conversely, we confirm that the increase in global CO2 emissions stimulates the demand for green financial products, as evidenced by a positive nexus during bullish CO2 emission regimes and various market conditions of green finance indices.
The study’s limitation lies in using global data for CO2 emissions and green investment prices, without considering country-specific data on both green assets and CO2 emissions. Consequently, the dependence between green financial markets and environmental pollution may vary depending on each country’s CO2 emission levels, environmental policies, and economic circumstances. Future research should aim to overcome this limitation by examining the dependence across different countries and time horizons, as the linkage can vary across various frequencies.