I. Introduction
Following the Global Financial Crisis (GFC), countries have adopted robust frameworks to monitor financial market activities and consequently embark on timely interventions to correct price and return anomalies. These anomalies could originate from irrational activities in the domestic market, external influences, or fluctuations in commodity prices, all of which can significantly affect stock market dynamics (Biswas et al., 2022; Brunnermeier & Oehmke, 2013; Jordà et al., 2015; Reinhart & Rogoff, 2009). Accordingly, several approaches have been deployed for early detection of price bubbles. A wide range of these methods border on the assessment of price volatilities (Diba, 1990; Gupta et al., 2024; Sornette et al., 2018) and unit roots (Phillips et al., 2015).
The assessment of price bubbles is of primary concern to oil-exporting countries (Tarlie et al., 2022) due to evidence of oil-price induced volatilities and consequent bubbles in the stock market. Although several studies have shown evidence of oil price impacting positively on stock returns (Alamgir & Amin, 2021; Albulescu, 2020; Lawal et al., 2016; Liu et al., 2023; Prabheesh et al., 2020; Salisu & Oloko, 2015; Shi & Kong, 2021), other studies counteract this position (Albulescu, 2020; Al-hajj et al., 2017; Bourghelle et al., 2021; Singhal et al., 2019). This, therefore, suggests a need to re-assess the oil-stock bubble nexus among leading oil-exporters, and by extension, detect the nature of these bubbles, establish their timestamp, and assess their duration, as this information is strongly relevant to policymakers, financial regulators, and market stakeholders.
Although, existing studies (Assaf et al., 2024; Huang & Wang, 2024; Li et al., 2020) have detected stock price bubbles in various markets of oil-exporting and non-oil-exporting economies, however, most of these studies have not performed a panel analysis of the markets. Another gap identified in Potrykus (2023) was the lack of time stamping for the periods of bubble formation. Consequently, this paper aims to fill this gap by detecting specific periods that market bubbles emerged and eloped. We would specifically determine whether the bubbles were multiplicative, both individually across the selected economies and collectively as a panel of oil exporters.
The rest of the paper is structured as follows. Section II presents the data and methodology. Section III presents results and discussions. Section IV contains the conclusion.
II. Data and Methodology
The paper attempts to detect bubbles in stock returns of oil-exporting economies (see Table 1) using a unit root approach. Data used in this paper are daily time series of stock returns of oil exporters, spanning April 15, 2013, to May 15, 2024. The timeframe was chosen based on data availability across the selected countries and the need to capture notable events such as post-GFC, COVID-19, and Russia-Ukraine war, whose impact have been deemed to be significant on stock returns, especially, that of oil-exporting markets. The selection criteria for the oil-exporters were based on the Observatory of Economic Complexities (OEC) rankings with supporting evidence from U.S. Energy Information Administration.
In their novel approach to detecting exuberance in the stock market, Diba & Grossman (1988) proposed an alternative test of unit root by contrasting the right tail of a distribution against its explosive alternative (see Pedersen & Schütte, 2020). Due to the relative weakness of the method in detecting negative bubbles, it was modified to include using the subset of the test data incremented by one observation at each run, and the largest value of the test statistics to test for explosiveness (see Phillips & Yu, 2011; and Diba & Grossman, 1988). This method is known as the Supremum Augmented Dickey–Fuller (SADF) test. The SADF improves the predicting power of the model even amidst negative bubbles and allows for a near-accurate determination of the cycle of a bubble. In furtherance, Phillips et al. (2015) developed a generalized version of the SADF test (GSADF) by allowing the variance of the sample window based on its start, peak and end period. Thus, the GSADF test is considered to have an even higher power in detecting periodically collapsing bubbles.
The Supremum ADF and generalized supremum ADF tests relies on the ADF regression specification:
Δyt= ar1,r2+γr1,r2yt−1+k∑j=1φjr1,r2Δyt−j+ϵt
where denotes a generic time series, with are lagged first differences of the series included to accommodate serial correlation, are normally distributed error terms, and and are regression coeffcients, while represent windows of the total sample size that state the starting, peak, and ending points of the subsample period.
The null hypothesis of interest is that variable has a unit root, against an alternative of the variable having an explosive behaviour.
III. Results
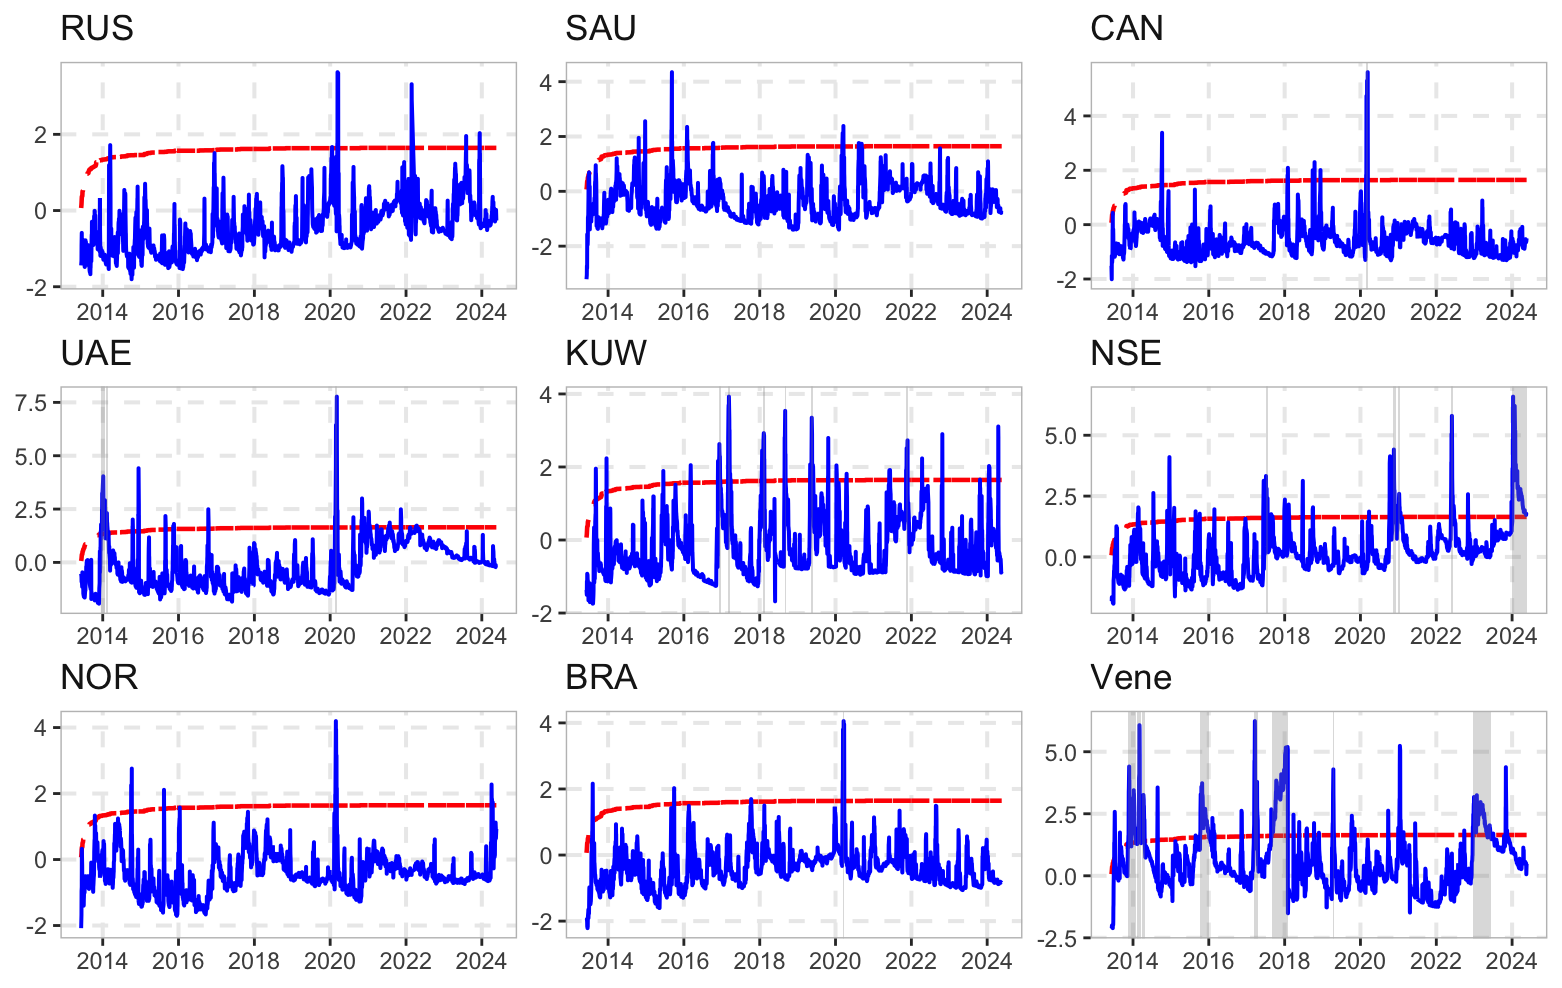
The SADF estimates present several episodes of speculative bubbles among the selected countries. The Venezuelan stocks exhibited the highest duration of explosive behaviours, followed by those of Kuwait, Nigeria, and the UAE. Contrarily, other oil exporters recorded mild explosions in their stock returns. This indicates strong evidence of irrational exuberance in the stock returns of the selected countries, thus, revealing their lack of absorptive mechanisms to dampen impending bubbles in their stock markets. (see further evidence in Abdou et al., 2024). The result also revealed that stock exuberance during the COVID-19 period was largely positive, except in Canada, Brazil, and the UAE where price bubbles were negative.
The Generalized SADF test detected multiplicative bubbles only in Nigeria and Venezuela. This could be attributed to their relatively high dependency on oil (see Figure 1). The persistent positive bubble formation in Venezuelan stock returns implies that beyond the dynamics in the oil market, there are intense speculative activities in the market (see Demirer et al., 2017). Conversely, the US market showed minimal evidence of price bubbles, due largely to broad economic diversification, tight regulations, counterintuitive measures against oil price swings and minimal currency depreciation effects on stock prices in the US market (see Gupta et al., 2024).

The panel estimation reveals that, as a conglomerate of oil exporters, there is evidence of multiplicative price bubbles in the selected markets, underscoring the need for investors to be cautious in their investment decisions in oil-exporting markets.
IV. Conclusion
The study examined stock bubbles in major oil-exporting countries using a univariate approach. It examines explosive patterns in stock returns of the selected countries at an individual level. In addition, a panel analysis of the countries was carried out to have a bloc assessment of the selected stock markets. The deflation of irrationally induced exuberances in the stock market could have severe consequences on the overall stability of the financial market and the economy at large. The paper presents evidence of explosive dynamics in the most selected stock markets, particularly, the less-diversified ones, such as Venezuela and Nigeria. We show that as an oil-exporting bloc, the panel results of stock returns equally show price bubbles. These bubbles were positive in most of the periods, but slightly negative, mainly during the COVID-19 period (Huang & Wang, 2024). The paper reveals the need for continued efforts towards economic diversification (see Abdou et al., 2024; Ben-Douissa & Azrak, 2023) from oil to serve as a buffer for economies adversely impacted by oil price swings.