I. Introduction
Climate change is a primary concern worldwide and designing effective policies is challenging for policymakers. Combating climate change requires sound and transparent policies. Uncertainty around climate policy may have a range of adverse effects on the economy, including decisions on investments, enterprises, and energy markets. Crude oil prices are sensitive to climate policies because these policies affect the production and transportation of crude oil (Wang et al., 2023).
Climate policy uncertainty (CPU), defined as the unpredictability of upcoming laws and policies on climate change, might impact crude oil prices through several mechanisms. First, CPU impacts crude oil supply and demand, influencing its price in the global market (Guo et al., 2022). Second, uncertainty regarding future climate legislation can impact energy-related investment decisions. If firms are concerned about the future demand for oil due to potential climate regulations, they may change their investment plans appropriately. As a result, oil prices may fluctuate. Indeed, stricter climate regulations may increase the cost of capital, thus reducing investment in impacted companies (Bogmans et al., 2023). Applying VAR-based structural scenarios, Boer et al. (2022) demonstrated that supply-side climate policies may increase oil prices. Third, market players’ perceptions of future climate policy can impact oil prices. If investors and traders expect stricter regulations, oil prices may rise even before the measures are formally adopted. Fourth, climate policies frequently seek to minimize dependency on fossil fuels, such as crude oil, in favor of greener energy sources. Doubt about the precise policies that will be adopted may cause ambiguity about future oil consumption. This uncertainty can impact market players’ expectations and trading behavior, resulting in volatility in oil prices. Fifth, climate regulations can spur technical innovation, especially in developing greener energy sources (Huo et al., 2024; Zhu et al., 2023). If these technologies become more affordable and widely used, they may impact long-term oil demand, impacting prices. Finally, international agreements on climate change may also impact geopolitical dynamics and the world’s energy dynamics. Oil price volatility can be caused by geopolitical events and uncertainty as traders adjust to changing geopolitical situations.
Although the impact of climate policy on crude oil prices is well established (Dike, 2014; Fahmy, 2022; Gupta & Pierdzioch, 2021; Ye, 2022), the empirical research on the CPU-crude oil price nexus is limited. Applying the DCC-GARCH methodology, Li (2022) investigated the time-varying spillover effects of the US CPU on crude oil prices and found that it is a net transmitter influencing crude oil prices. Relying on a quantile-on-quantile approach and monthly data from December 2001 to March 2021, Ding et al. (2022) examined the impact of CPU on crude oil prices. Their findings imply that CPU has a more significant effect on crude oil prices during periods of market depression. Guo et al. (2022) studied the nonlinear impacts of CPU on global crude oil prices. They found that climate policy uncertainty significantly affects crude oil prices. Using quantile VAR and quantile connectedness measures, Wang et al. (2023) reported stronger connectedness between CPU and crude oil prices in the upper and lower quantiles. Finally, Salisu et al. (2023) observed that an elevated CPU promotes crude oil market risk.
The literature listed above mainly investigates the symmetric relationship between CPU and crude oil prices. Nevertheless, the asymmetry between the two variables is still a significant gap in the literature. This study aims to fill this gap.
Apart from the symmetric causality between CPU and crude oil prices, there might be an asymmetric link between the two variables. In contrast to a symmetrical relationship with a uniform impact, the causality between CPU and crude oil prices might be characterized by asymmetry, suggesting that the direction and magnitude of influence are not equivalent. Indeed, crude oil price changes (negative and positive) may respond differently to negative and positive CPU changes. Similarly, CPU changes may react differently to negative and positive crude oil price changes.
Against this backdrop, the main objective of this study is to examine the symmetric and asymmetric causal relationships between CPU and crude oil price changes using the Fourier-Toda-Yamamoto causality (F-TY) framework and monthly data from April 1987 to April 2023. We find that positive and negative changes in CPU increase crude oil prices.
Our study contributes to the literature in two main ways. First, it uses a novel and sophisticated technique - the F-TY causality framework - that sheds light on the temporal dynamics of the link between CPU and real crude oil prices (RCOILP). Second, it is the first to investigate asymmetric causal relationships between CPU and RCOILP.
The following is how the study progresses. The next section focuses on the empirical approach and data. Section III presents the findings and a discussion. Section IV concludes.
II. Empirical Strategy and Data
This research employs the Fourier-Toda-Yamamoto causality (F-TY) approach developed by Nazlioglu et al. (2016). This framework extends Toda & Yamamoto’s (TY) (1995) Granger non-causality test, providing more robust results by addressing the structural breaks of unknown dates, numbers, and forms. Like the TY test, the F-TY test is robust to different variable integration orders, and the vector autoregressive (VAR) model does not require cointegration.
The F-TY relies on the VAR (p+dmax) and may be configured as follows:
yt=φ(t)+β1yt−1+....+βp+dyt−(p+d)+ut
where represents any structural changes in the dependent variable or the intercept as a function of time.
The Fourier approximation in Eq. (2) enables us to account for structural changes, break numbers, and break forms.
φ(t)=φ0+n∑k=1γ1ksin(2πktT)+n∑k=1γ2kcos(2πktT)
where n is the number of frequencies, and measures the frequency’s amplitude and displacement, respectively.
Eq. (2) may be expressed as a single Fourier frequency component in the following way:
φ(t)=φ0+γ1sin(2πktT)+γ2cos(2πktT)
In Eq. (3), the approximation’s frequency is indicated by the letter k.
As a last step, one may generate F-TY with a single Fourier frequency causality by substituting Eq. (1) into Eq. (3) resulting in the following:
y(t)=φ0+γ1sin(2πktT)+γ2cos(2πktT)+β1yt−1+....+βp+dyt−(p+d)+ut
Instead of using the Wald test, Nazlioglu et al. (2016) suggest using F-statistics to carry out the Granger non-causality test.
To investigate possible asymmetries, we divide CPU and RCOILP changes into negative and positive ones, as Shin et al. (2014) demonstrated.
CPUt_p =t∑j=1ΔCPUj_p=t∑j=1max
\begin{aligned} \mathbf{CP}\mathbf{U}_{\mathbf{t}}\mathbf{\_ n\ } & \mathbf{=}\sum_{\mathbf{j = 1}}^{\mathbf{t}}{\mathbf{\Delta CP}\mathbf{U}_{\mathbf{j}}\mathbf{\_ n}}\\ & \mathbf{=}\sum_{\mathbf{j = 1}}^{\mathbf{t}}{\mathbf{\min}\mathbf{\ }\mathbf{(}}\mathbf{\Delta CP}\mathbf{U}_{\mathbf{j}}\mathbf{,0)} \end{aligned}\tag{6}
\begin{aligned} \mathbf{RCOIL}\mathbf{P}_{\mathbf{t}}\mathbf{\_ p\ } & \mathbf{=}\sum_{\mathbf{j = 1}}^{\mathbf{t}}{\mathbf{\Delta RCOIL}\mathbf{P}_{\mathbf{j}}}\mathbf{\_ p}\\ & \mathbf{=}\sum_{\mathbf{j = 1}}^{\mathbf{t}}{\mathbf{\max}\mathbf{\ }\mathbf{(}}\mathbf{\Delta RCOIL}\mathbf{P}_{\mathbf{j}}\mathbf{,0)} \end{aligned}\tag{7}
\begin{aligned} RCOILP_{t}\_ n &= \sum_{j = 1}^{t}{\Delta RCOILP_{j}}\_ n\\ & = \sum_{j = 1}^{t}{\min\ (}\Delta RCOILP_{j},0) \end{aligned}\tag{8}
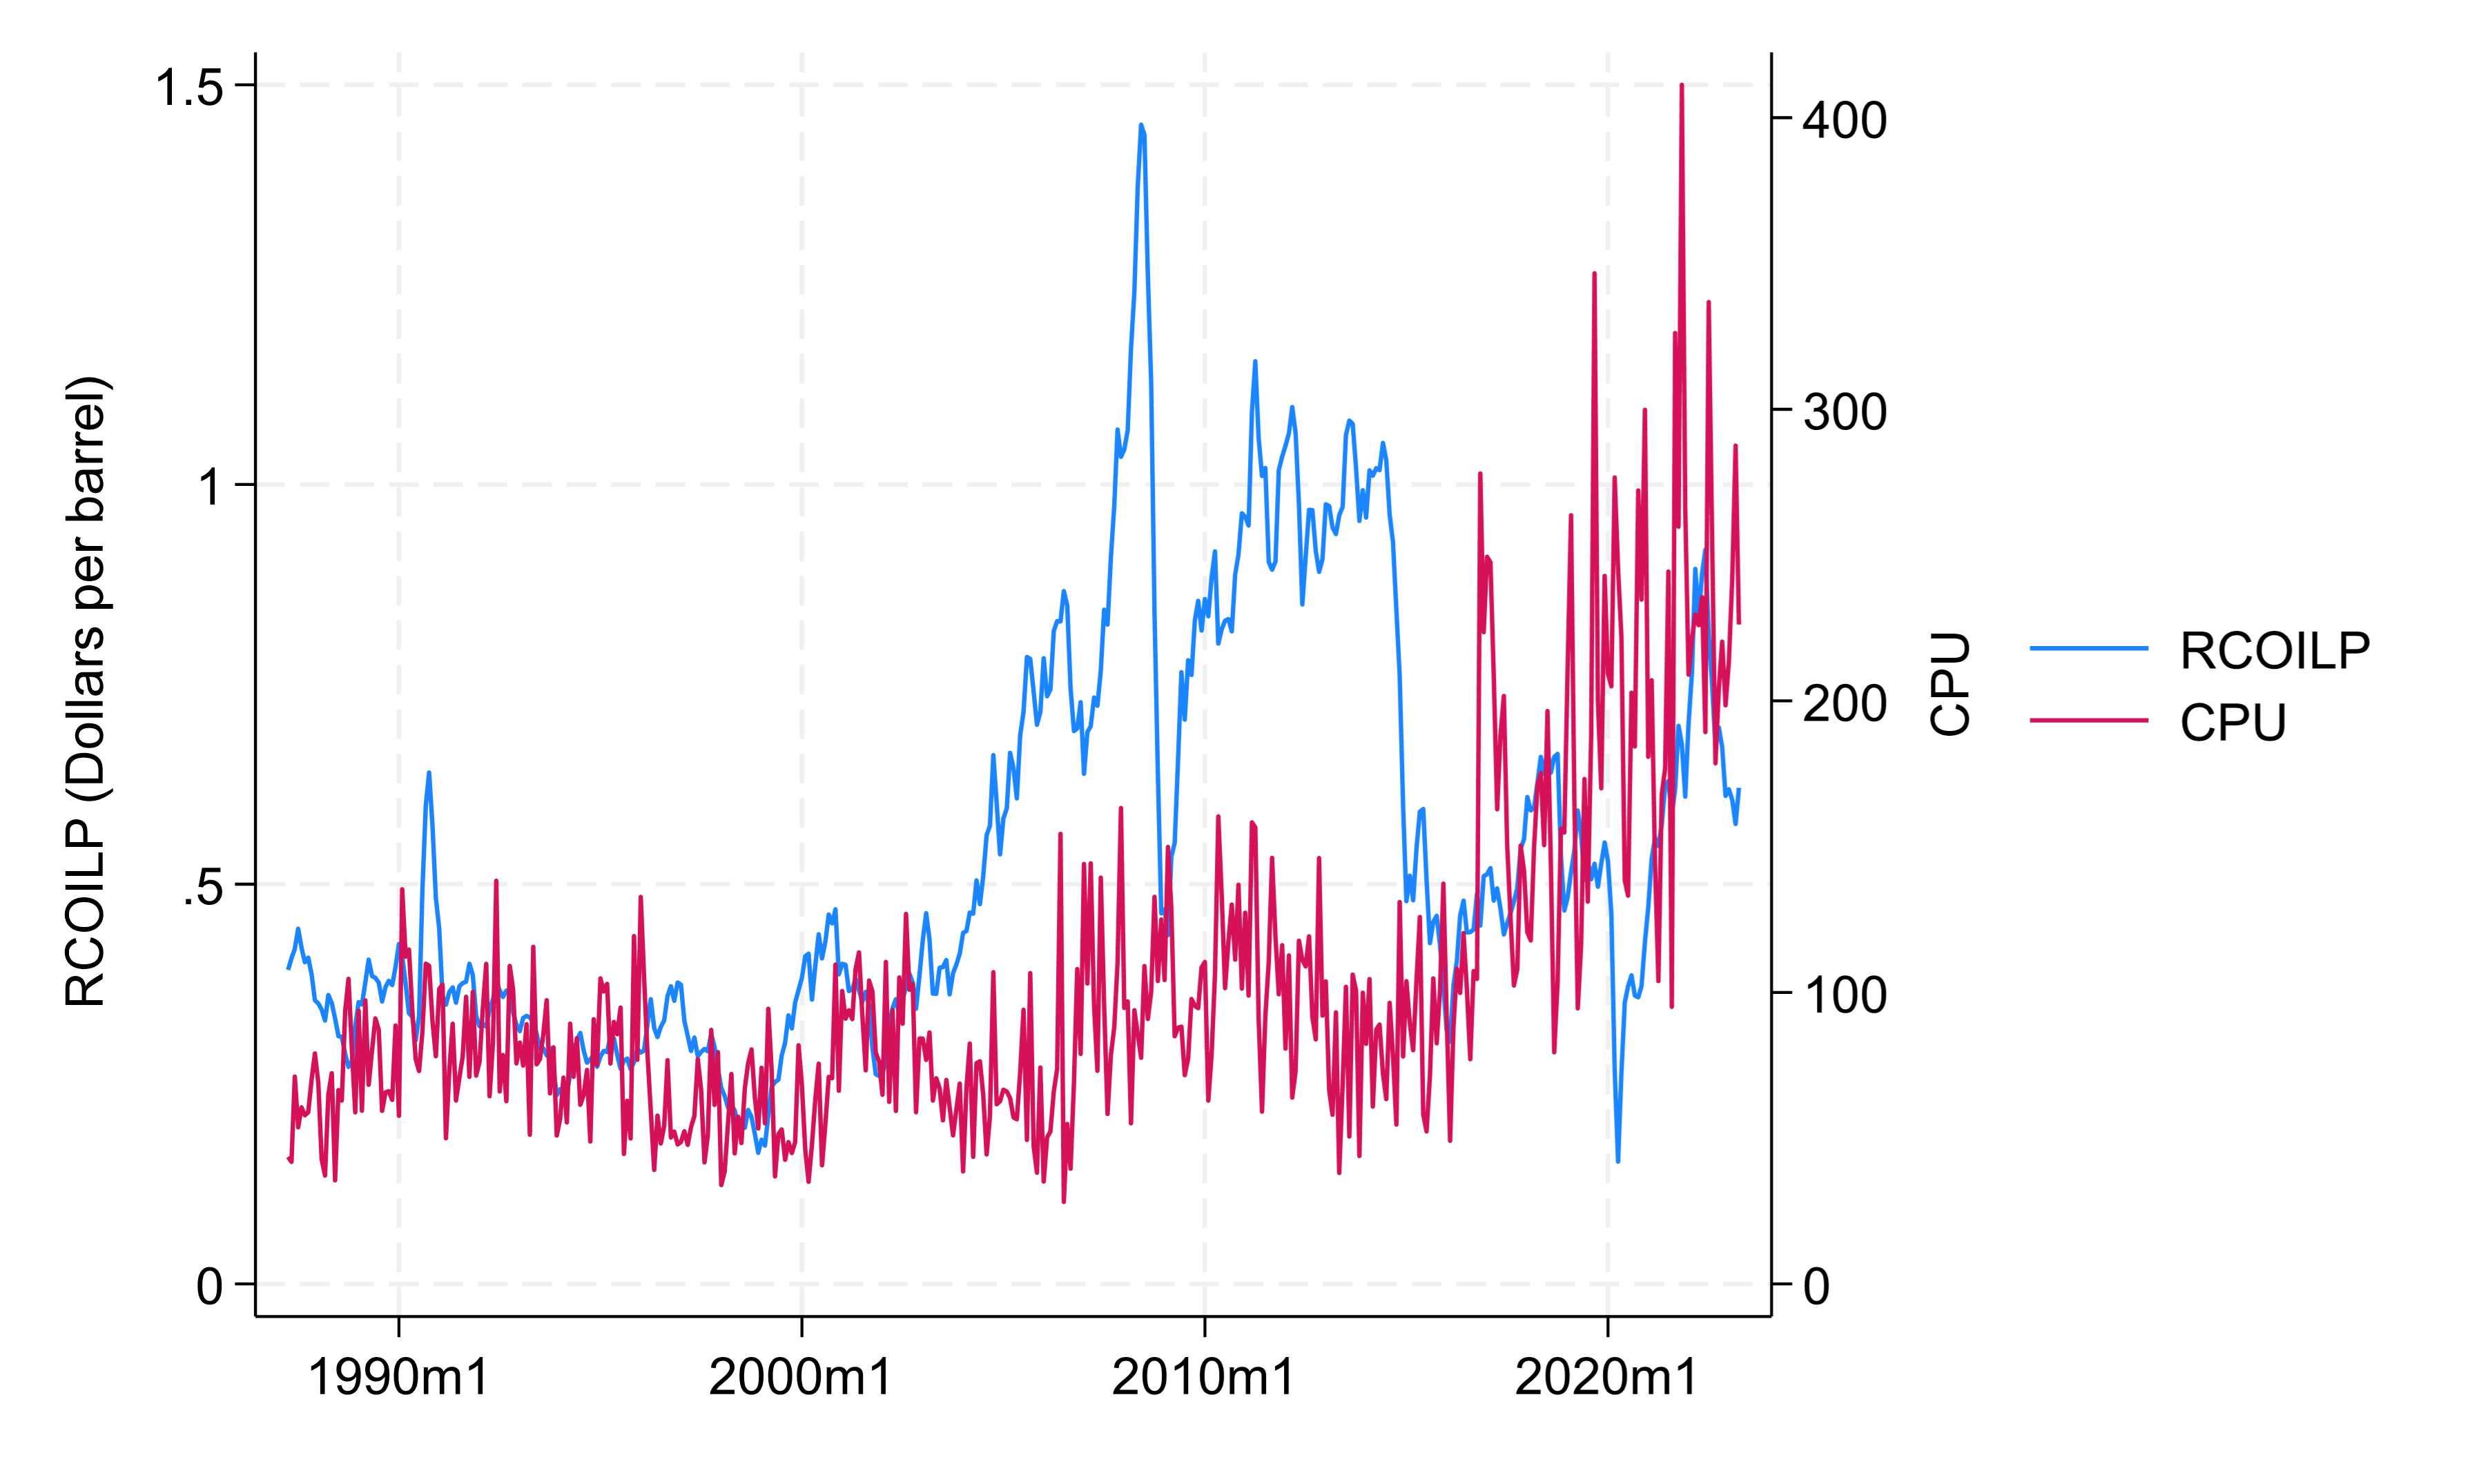
We use monthly data from April 1987 to April 2023 on CPU and RCOILP. The CPU index computed by Gavriilidis (2021) is used as a proxy for climate policy uncertainty. Based on the text mining technique, this index gauges changes in environmental policy. Higher index scores indicate heightened uncertainty in CPU. Crude oil prices are measured by the West Texas Intermediate (WTI) spot price FOB (Dollars per barrel) and retrieved from the U.S. Energy Information Administration (EIA) website.[1] For the analysis, we utilize real oil prices rather than nominal ones to isolate the CPU’s influence by excluding the possible impact of inflation that may arise from demand or supply shocks frequently influencing the movement of oil prices. Accordingly, nominal crude oil prices are converted to real prices (RCOILP) using the U.S. consumer price index from the U.S. Bureau of Labor Statistics.
Figure 1 plots the evolution of the CPU and RCOILP. We observe that RCOILP peaked in July 2008 and fell to its lowest point in April 2020, which can be attributed to the global financial crisis of 2008 and the COVID-19 pandemic, respectively. Moreover, Figure 1 shows that the CPU has steadily increased since 2016, peaking in November 2021. Finally, Figure 1 depicts an asymmetric trend in CPU and RCOILP.

Table 1 reports the descriptive statistics, correlation matrix, and Broock et al. (1996) BDS test statistics. The variables CPU and RCOILP are positively correlated. In comparison to RCOILP, the CPU has the most volatility. Both variables show positive asymmetry and excess kurtosis (greater than 3). The Jarque-Bera test results demonstrate that neither series is normally distributed. Finally, the BDS test findings corroborate the nonlinear or asymmetric relationship between CPU and RCOILP, implying that asymmetric causality is a feasible hypothesis.
III. Results and discussion
We first identify the stationarity of variables using the Zivot-Andrews (1992) test, and the results reported in Table 2 show that all the variables are stationary at level I(0).
Then, using the Nazlioglu et al. (2016) F-TY approach, we assessed the causal relationship between CPU and RCOILP, and the key findings are reported in Table 3. Regarding symmetric causality (Panel A of Table 3), we find statistically significant unidirectional causality from CPU to RCOILP, suggesting that CPU has an important value for predicting RCOILP.
Concerning asymmetric causality (Panel B of Table 3), we observe that a heightened CPU causes an increase in crude oil prices, suggesting that if investors are unsure about the direction and strength of future renewable energy legislation, they may postpone or reduce investments in cleaner energy technology. This delay may result in increasing reliance on existing fossil fuel supplies, potentially leading to a rise in oil prices. The results also indicate that negative changes in CPU (a decrease in CPU) cause an increase in RCOILP. This finding implies that climate policies regarded as less restrictive on fossil fuel usage may result in a rise in global oil demand. This increased demand may pressure oil prices, particularly if production capacity fails to keep up with expanding consumption. Finally, a surge in RCOILP reduces CPU. One interpretation of this result is that rising oil prices may encourage investment and the development of alternative energy solutions. As the cost competitiveness of renewable energy sources improves, policymakers may be more willing to embrace policies that assist in the transition to a low-carbon economy, lowering CPU.
IV. Conclusion
This paper applies the Fourier–Granger causality approach to investigate the symmetric and asymmetric causal relationships between CPU and RCOILP from April 1987 to April 2023. We find unidirectional symmetric causality from the CPU to the RCOILP. Regarding asymmetric causality, the results reveal that positive and negative changes in CPU lead to a greater RCOILP. Moreover, positive changes in RCOILP reduce CPU. Given positive and negative changes in the CPU spike RCOILP, policymakers should consider asymmetry when tailoring climate policy to stabilize crude oil markets. Future research can employ time-varying, wavelet, and quantile causality methodologies to study the asymmetric causality relationship between CPU and RCOILP.
Acknowledgments
The author thanks the Editor (Prof Afees Salisu) and anonymous reviewers for their helpful remarks and recommendations, which greatly improved the paper.
http://www.eia.gov/dnav/pet/pet_pri_spt_s1_m.htm, Date of Access:12.11.2023