I. Introduction
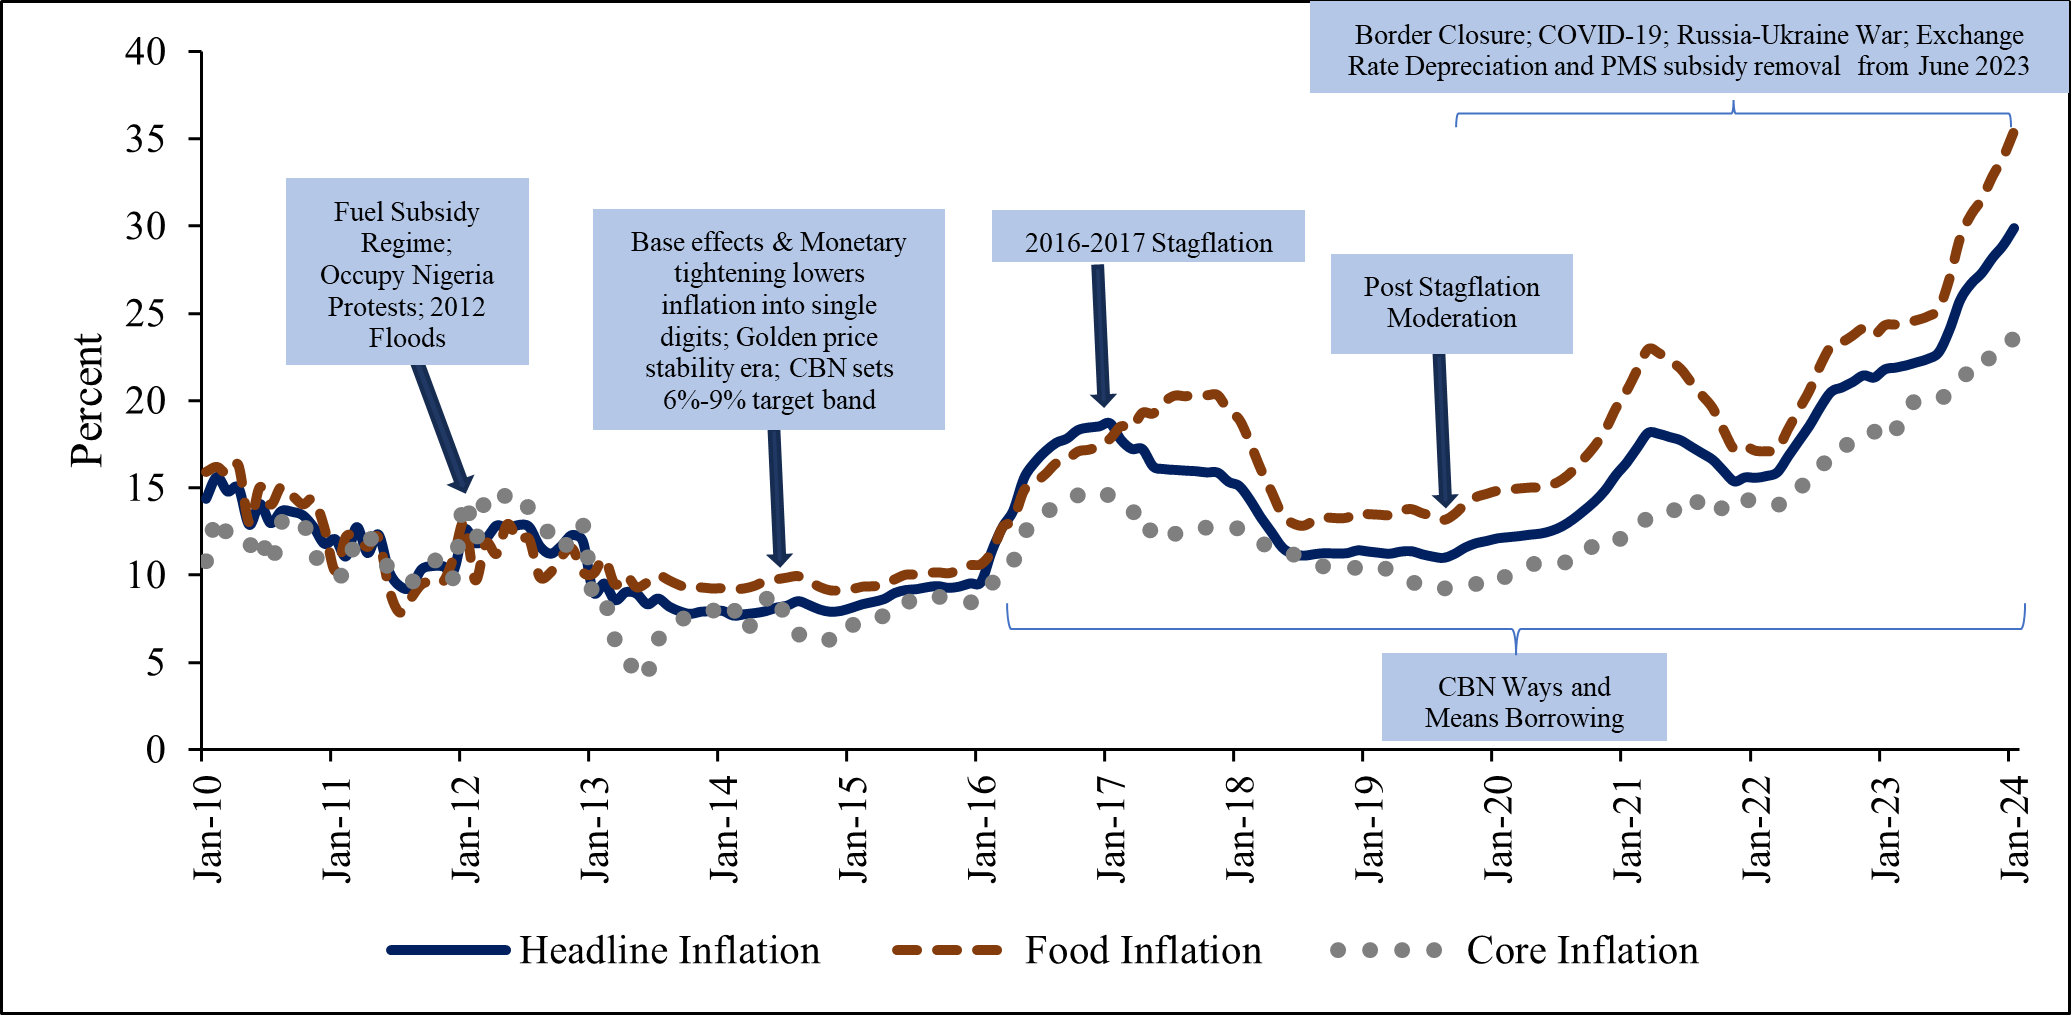
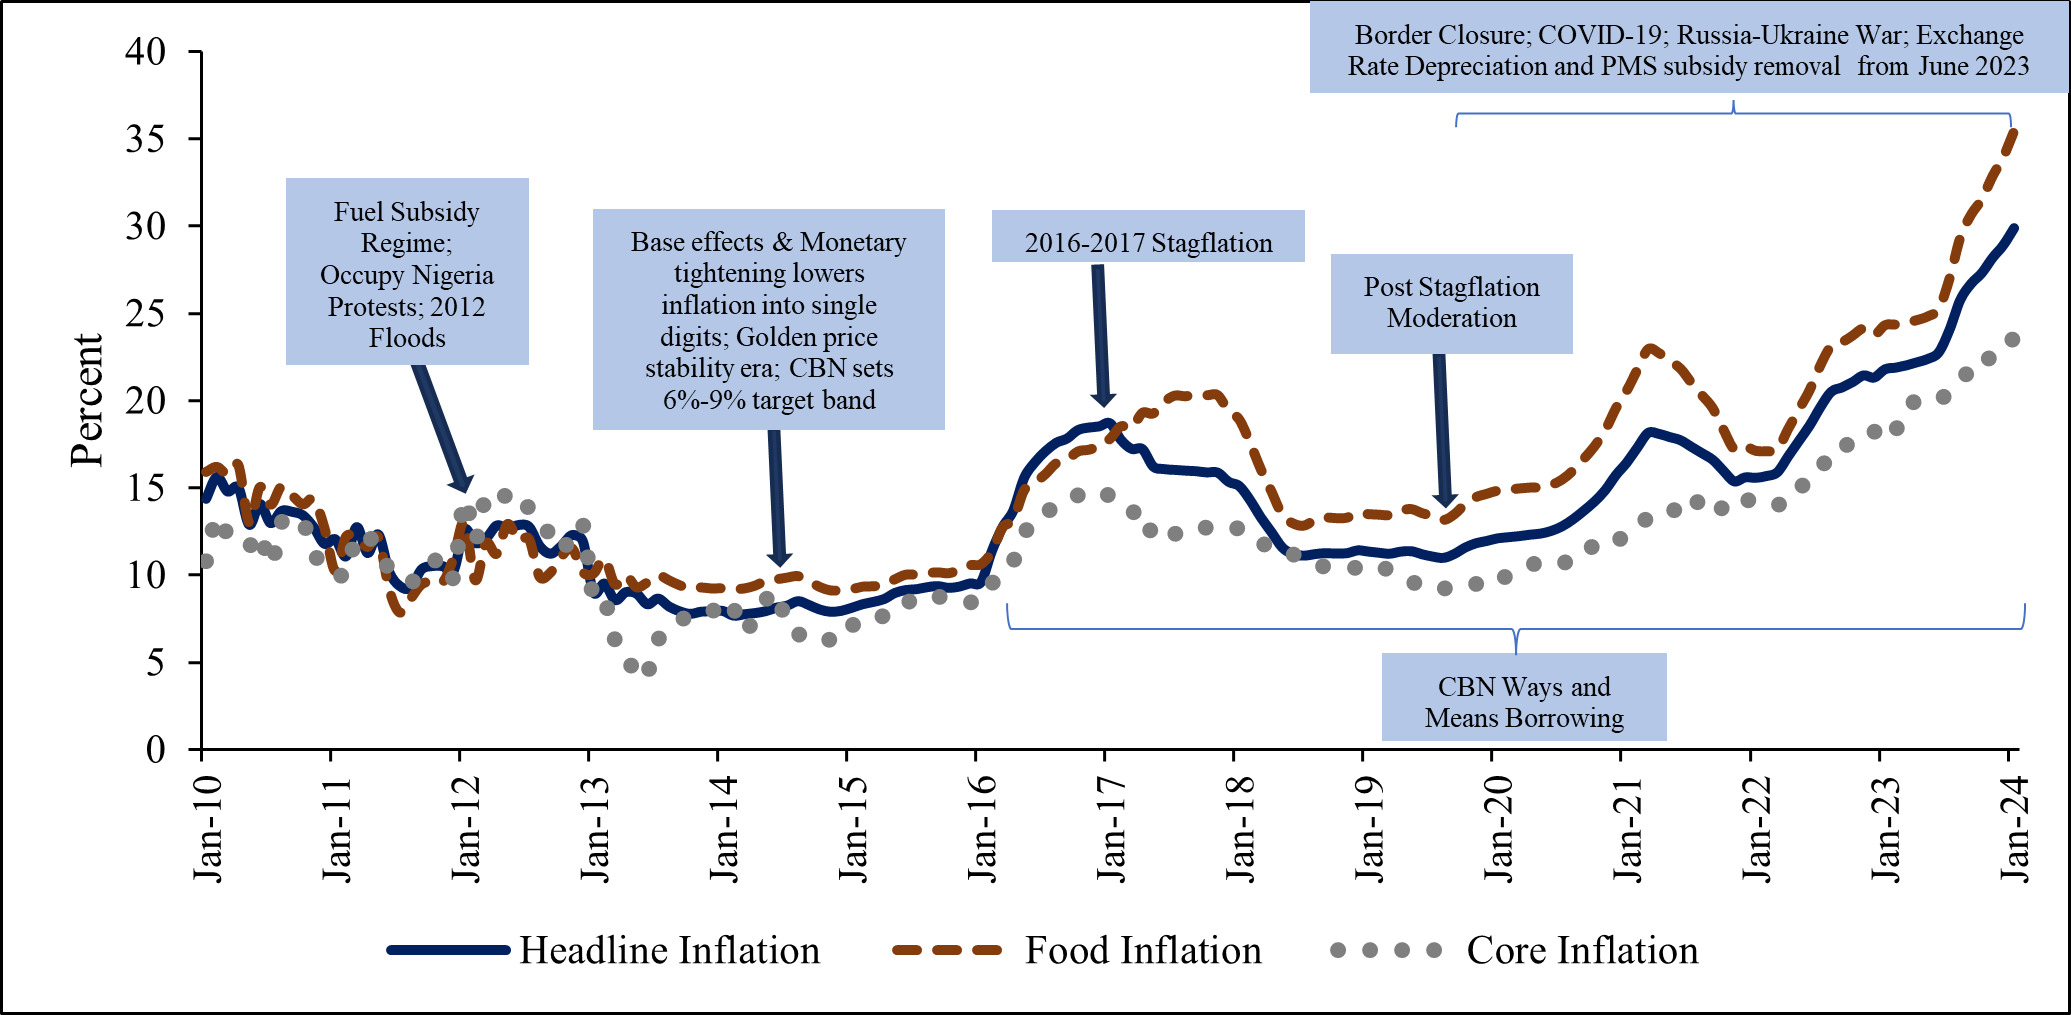
Inflation has tripled in Nigeria over the previous eight years, hurting the living conditions of cash-strapped households in Africa’s largest economy. According to Nigeria’s National Bureau of Statistics (2024a), the country’s inflation rate has increased to double digits since February 2016, fuelled mainly by food inflation, a major component of the consumer basket (see Figure 1). Rising food inflation in Nigeria coincided with the period when the Central Bank of Nigeria (CBN) started its ‘Ways and Means’ borrowing to the government, further compounded by several other economic events, including domestic factors such as border closures, currency devaluation, inadequate infrastructure, and economic inefficiency. External factors, such as falling crude oil prices in 2016, the resulting stagflation witnessed in 2016/2017, land border closures in 2019, and recent events like the COVID-19 pandemic, supply chain bottlenecks from China and the global elevated commodity prices due to the war in Ukraine, have compounded the existing problems, leaving many Nigerian households in a cost-of-living crisis they were not adequately prepared for. The war in Ukraine, in particular, has led to increases in the prices of food and energy commodities globally.
The rising living costs in Nigeria have emerged as a significant and pressing issue, particularly among the poor and vulnerable segments of the population. The situation worsened after Russia announced its war on Ukraine, leading to the recent soaring prices and falling living standards many Nigerians are facing. The cost-of-living crisis worsens each month as inflation continues to rise, peaking at 34.19% in June 2024—the highest rate since the return to democracy in 1999. Consequently, the decline in households’ purchasing power has led to numerous business closures, increased poverty, and reduced production indices in Nigeria, with real GDP growth averaging 1.4% over the past eight years compared to 6.5% in the preceding eight years (World Development Indicators, 2023). In picturesque format, Figure 1 details the various factors affecting consumer inflation in Nigeria over the past fourteen years.
Revisiting the literature on the cost-of-living crisis reveals that this issue is a global phenomenon, not limited to the Nigerian economy. While many advanced countries have begun to recover from its effects, the crisis persists. For instance, Webster & Neal (2022) were of the view that the cost-of-living crisis in the UK has led to the establishment of pernicious cycles of poverty, starvation, and inequalities, which demonstrate that no single aspect of the crisis can be resolved in isolation, and no nation is impervious to its consequences. Khan (2022) further opined that the cost-of-living crisis is compounding the challenges faced by families living on the brink of poverty, leading to society becoming more impoverished and more systematically unequal due to the cost-of-living crisis, a thought also echoed by Jeraj (2024). In Nigeria, studies by Orjiakor et al. (2023) and Ibukun & Adebayo (2021) were of the view that the COVID-19 pandemic increased household food insecurity and poverty levels in Nigeria. However, Yunusa et al. (2023) opined that the recent withdrawal of fuel subsidies has led to an imminent fuel scarcity crisis, leaving millions of Nigerians frightened about the potential negative consequences on their daily lives, while Chiripanhura & Niño-Zarazúa (2016) was of the view that food and fuel crises have significant effects on poor Nigerians. As a result, the key question becomes, how have recent economic events led to the cost-of-living crisis in Nigeria? This study takes a more comprehensive approach to understanding and investigating how these factors have impacted the cost-of-living crisis and recommends policies to curb soaring prices in Nigeria.
II. Methodology and Theoretical Framework
A.I. Theoretical framework
To study the effects of the cost-of-living crisis on economic well-being in Nigeria, the study adopted the price elasticity of demand theory due to its support for investigating how a change in demand results from a change in prices.
A.I.I. Price Elasticity of demand
The theory of price elasticity of demand, introduced by Alfred Marshall in 1890, serves as the foundation of this paper. Marshall posits that the elasticity of demand in a market is either significant or negligible, depending on whether the amount demanded increases significantly or marginally in response to a given decrease in price and decreases significantly or minimally in response to a given increase in price. This implies that the elasticity of demand is the statistical explanation of the proportional change in demand resulting from the factors that influence it. Demand responsiveness is the degree to which demand is affected by price fluctuations. The price elasticity of demand theory elucidates the conditions under which an increase or decrease in price affects the quantity demanded. Even though this theory has been criticised by Paul Samuelson, who regards the concept of elasticity as essentially arbitrary and of “no consequence” and as a “mental exercise for beginning students,” it remains of great relevance to this paper in terms of economic analysis. This is because it serves as a tool for explaining certain economic policies, such as removing fuel subsidies and their multiplier effects on the cost-of-living crisis or any other economic event, such as exchange rate depreciation and their effect on the cost-of-living crisis in Nigeria.
A.II. Materials and methods
To explore how Nigerians have been affected by the cost-of-living crisis, the study will examine the impacts of key macroeconomic variables on real household consumption and real gross domestic product (GDP) per capita. These variables include the inflation rate (proxied by headline inflation), the exchange rate (proxied by the log of official exchange rates, LEXC), the premium motor spirit or petrol prices (proxied by the log of PMS, LPMS), and the cost of agricultural production (proxied by the log of GDP Deflator for the agricultural sector, LAGRIC). Furthermore, to proxy the cost-of-living crisis, the study used data on real GDP per capita (proxied by the log of real GDP per capita, LRGDPPC), and real household consumption expenditure (proxied by the log of real household consumption, LRHC). These data were sourced from the CBN Statistical Bulletin (2023) and the National Bureau of Statistics (2024b). Therefore, modelling these relationships gives the below equation:
CoL=f(x)
where x is a vector of the independent variables (inflation, exchange rate, cost of agricultural production, and petrol prices), CoL is a vector of dependent variables including the log of real GDP per capita and household consumption. Re-specifying Equation (1) to its econometric form gives:
CoLt=α1+β2xt+εt.
To achieve the study’s objective, the Feasible Quasi Generalised Least Squares (FQGLS) estimator, which was proposed by Westerlund & Narayan (2015) was adopted. This estimator helps us avoid the unit root problem characteristic of numerous macroeconomic variables, including those under investigation, and to mitigate any endogeneity bias that may arise from the bivariate model specification. Moreover, given that the dependent and explanatory variables, like numerous other macroeconomic variables, exhibit a stochastic trend that renders them non-stationary and, as a result, present a persistence effect, the specification in Equation (2) cannot be explicitly estimated using the least squares technique. The FQGLS estimator assists in the correction of these effects, as well as any potential heteroscedasticity, by pre-weighting the data using the inverse of the standard error of the residual derived from Equation (2). To account for this, the Equation (2) is re-written as:
logCoLt=α1+βadj1xt+λΔxt+τlog(CoLt−1)+εt
III. Analysis and Presentation of Results
Table 1 presents the summary statistics of the variables. The summary of the data set in Panel A showed that the variables were ideally suited for the regression, while Panel B showed that the independent variables were highly correlated. This led to running four separate regressions for the independent variables, each with a single independent variable and dependent variable. Because two dependent variables were employed, the total regressions thus were four separate regressions on each dependent variable, bringing a total of eight regressions. Furthermore, the unit root tests in Table 2 showed that all the variables exhibit unit root, meaning that using the FQGLS technique is suitable in analysing the objective of the study. The results of the main analysis in Table 3 showed that inflation affected real GDP per capita and real household spending negatively in Nigeria. Furthermore, an increase in agriculture production cost led to a reduction in real GDP per capita and real household consumption. These results were the same for exchange rates and petrol prices since a depreciation in the exchange rate has led to a fall in real GDP per capita and real household consumption, while an increase in petrol prices has the same negative effect on real GDP per capita and real household consumption. The implications of these results will be discussed in the next section.
IV. Conclusion and Policy Recommendations
This study examined how rising cost-of-living conditions have affected household buying power in the Nigerian economy. It demonstrated the causes of the conditions, their impacts, and the implications for the poor and most vulnerable households. If the cost-of-living crisis is not properly handled, it may deepen inflation and the existing poor standard of living. Consequently, the study provides the following recommendations to guide the economy towards a more sustainable and resilient path.
First, adopting fiscal policies that encourage price stability, investing in vital infrastructure to minimise production costs, and supporting projects to boost domestic agricultural output are all examples of what may be done to combat the nation’s cost-of-living crisis.
Second, public-private partnerships that create jobs, engage in charitable activities, and invest in strategic sectors that directly impact the lives of the poorest and most vulnerable households are essential to cushioning the effects of the crisis.
Third, empowering local industries reduces the dependence on imported commodities, which are vulnerable to price swings and currency depreciation. Small and medium-sized enterprises are important drivers of economic development and job creation in any economy.
In addition, the CBN should help tackle the problem of inflation, particularly food inflation, to help stabilise prices. The CBN should coordinate its actions with the fiscal authorities for them to be more effective in combating inflationary pressures.
Finally, the pursuit of structural reforms and the revival of economic development are only possible by strengthening the macroeconomic fundamentals. A more resourced and efficient government that delivers efficient public goods and services and a favourable economic climate for the private sector to develop might improve the present economic conditions and build a more resilient economy.