I. Introduction
The persistent conflict in Ukraine has caused increases in the costs of energy, raising interest in the impact of geopolitical risks on European and global energy markets. The supply disruptions caused by the conflict led to record-high European natural gas prices of $70/mmbtu in August 2022 (World Bank, 2022). This impact underscores the critical role of geopolitics in energy price dynamics, a relationship well-documented (see Aslam et al., 2022; Liu et al., 2021; Song et al., 2022). Thus, this study seeks to examine how the escalation of geopolitical risks in key European natural gas-producing countries (Russia, Ukraine, the Netherlands, Norway, and the UK) affects price exuberance in Europe’s market.
Two major considerations motivate this study. First, natural gas plays a vital role in heating, power generation, fertilizer production, and driving the ongoing inflation caused by supply chain disruptions. Second, recent evidence shows that the heightening of geopolitical risks in Ukraine fuels price exuberance in the European natural gas (Su et al., 2023) and international energy markets (Mamman et al., 2024). Therefore, the distinctive contribution of this study lies in its exclusive focus on adverse geopolitical risks originating from major natural gas producers in Europe. The findings suggest that geopolitical risks in these countries are pivotal in initiating and ending price exuberance in Europe’s natural gas market. Our findings also align with existing literature on commodity price exuberance (Balcilar et al., 2014; Floros & Galyfianakis, 2020; Khan et al., 2021; Potrykus, 2022; A. Salisu et al., 2023; A. A. Salisu et al., 2024; Umar et al., 2021; Yang et al., 2021). The findings also support the link between geopolitical risks and energy prices (Aslam et al., 2022; Liu et al., 2021; Mamman et al., 2024; Song et al., 2022; Su et al., 2023) and confirm the significant impact of geopolitical uncertainties on price booms (Y. Li et al., 2020; Wang & Kim, 2022). These insights can guide the development of corrective measures and serve as early indicators for policymakers to anticipate natural gas price exuberance in Europe.
The rest of the paper is organized as follows. Section II presents the methodology while section III discusses the empirical results & findings. Section 6 concludes and highlights the policy implications.
II. Methodology
A. Theoretical Frameworks of Bubbles
The bulk of the studies on asset price bubbles has focused on stock markets, yet these principles also extend to commodity markets. On the one hand, the Efficient Market Hypothesis (EMH) posits that asset prices in efficient markets reflect true values, precluding the existence of bubbles (Abreu & Brunnermeier, 2003; Fama, 1965). On the other hand, Rational Bubbles theory suggests that prices can deviate from true values, allowing bubbles to form (Blanchard & Watson, 1982; Diba & Grossman, 1988). The rational intrinsic bubbles model emerged, attributing bubbles to overreactions to stochastic dividends (Froot & Obstfield, 1991; Ivana & Luboš, 2011). Shiller (2015) argues against the EMH, asserting that inefficiencies and irrational behaviours can lead to bubbles, a view supported by his feedback loop hypothesis. Consequently, the present value asset pricing model has become a tool for bubble prediction (Phillips & Shi, 2018). The model depicts how prices can deviate from their fundamentals, resulting in the formation of bubbles. Following the lead of Sharma and Escobari (2018), the present value model of rational commodity pricing is specified as follows:
Pt=Et(Pt+1+Ct+1)(1+R)
where is the real commodity price at time t, is the convenience yield for the storable commodity, and R>0 is the constant discount rate. The convenience yield is a return derived from having access to the commodity held in inventory. Sharma and Escobari (2018) demonstrate that solving Equation (1a) iteratively using first-order Taylor expansion yields the following:
pt=pft+bt
Equation (1b) shows that a commodity price is determined by its fundamental value and a bubble component In the presence of a bubble >0], the commodity price will be explosive, as detailed by Phillips et al. (2015) and Phillips and Shi (2018). In this light, this study follows the tradition of Phillips et al. (2011) to define a bubble as “explosive autoregressive behaviour” of the price of assets. This definition allows for modelling bubble growth as a mildly explosive process. In addition, this study also relies on Lucas’s (1978) fruit-tree model which predicts that significant risk factors such as geopolitical tensions tend to be reflected in asset prices (including commodities) and could trigger multiple bubble episodes.
B. Empirical Detection of Price Exuberance in European Natural Gas Market
The Generalized Supremum Augmented Dickey-Fuller (GSADF) test is used in this study to detect the presence and dates of price exuberance in European natural gas prices. The GSADF test was chosen because of its wide application in detecting the presence and occurrence dates of commodity price bubbles (Floros & Galyfianakis, 2020; Khan et al., 2021; Y. Li et al., 2020; Z.-Z. Li et al., 2022; Potrykus, 2022; Umar et al., 2021). Furthermore, the GSADF test is more efficient than techniques such as the Sup Augmented Dickey-Fuller (SADF) test, Regime-Switching, and Log-Periodic Power Law (LPPL) models (Philips et al., 2015). Thus, in the tradition of Phillips et al. (2015), we express Equation (1b) into an empirical model as follows:
Δyt=αr1,r2+βr1,r2yt−1+k∑i=1ψir1,r2Δyt−1+εt
where yt is the European natural gas prices, k is the lag order, r1 is the (fractional) starting point of the estimation sample, and r2 is the (fractional) point of the estimation sample. The GSADF statistic is used to infer the presence of explosive behaviour within the sample period from Equation (2). In addition, the Backward Sup ADF (BSADF) test is used to date-stamp the explosive episode’s occurrence and termination dates. The BSADF test runs a right-tailed unit root test against an explosive alternative several times on a backwards-expanding sample sequence (Phillips et al., 2015).
C. Estimating the Effect of Geopolitical Risks on Price Exuberance in the European Market
The logit model has been used to identify the determinants of price exuberance (bubbles). Thus, the logit model is used in this study to examine the effect of geopolitical risks on price exuberance in the European natural gas market. The logit model was chosen because prior studies such as Wang and Kim (2022) and Khan et al. (2021) used the model to examine the determinants of price bubbles in energy markets. The logit model is described below:
Bbubblest=β0+β1GPRRussiat+β1GPRUkrainet+β1GPRNorwayt+β1GPRNetherlandt+β1GPRUKt+εt
From Equation (3), GPRt indicates geopolitical risks. The disturbance term is is a binary variable whereby shows an episode of price exuberance, whereas indicates absence of price exuberance. This study estimates Equations (2) and (3) with monthly data from 1990M01 to 2022M10 sourced from https://www.worldbank.org/en/research/commodity-markets and https://www.matteoiacoviello.com/gpr.htm.
III. Empirical Results and Discussion
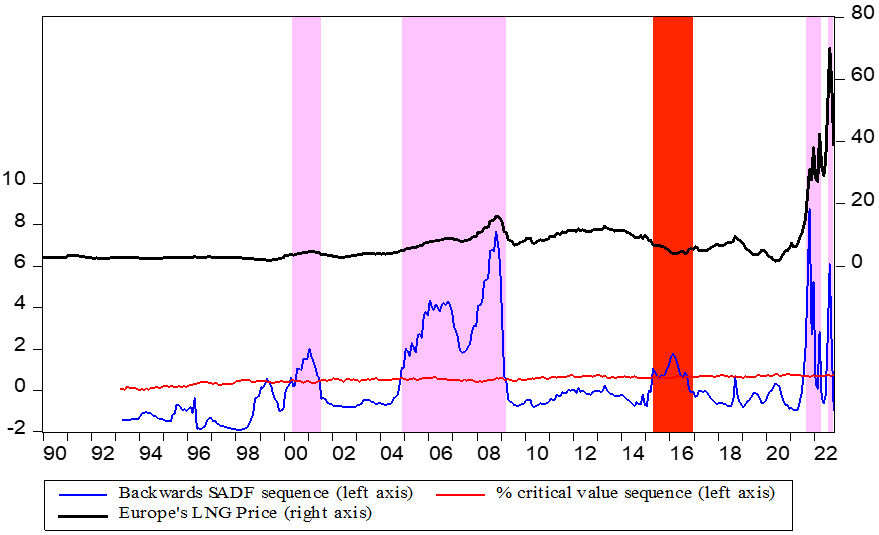
Table 1 presents the GSADF test results, which indicate significant price bubbles in European natural gas markets, with a GSADF statistic of 8.76 at the 1% significance level. While the GSADF test does not pinpoint the exact timing of these bubbles, Figure 1, through the BSADF test, identifies their start and end dates.
The absence of explosive events for Norwegian, Russian, Azerbaijani, and global crude oil markets in Table 1, alongside the BSADF test results in Figure 1, suggests a lack of price exuberance in these markets. It further illustrates multiple episodes of price inflation in European natural gas.

This empirical evidence aligns with the findings of multiple price exuberance instances documented in literature, such as those by Balcilar et al. (2014) and Yang et al. (2021). Particularly, periods of price exuberance, such as the 52 months from November 2004 to February 2009 and shorter episodes coinciding with the Russia-Ukraine conflict, suggest that geopolitical events significantly influence market prices.
Table 2 details these durations, while Table 3 assesses the impact of geopolitical risks on price exuberance, revealing that Ukrainian and UK risks increase the likelihood of exuberance, whereas Russian risks decrease it.
This study confirms the strong correlation between geopolitical risks and price exuberance in the European natural gas market, echoing the sentiments of Su et al. (2023) and Mamman et al. (2024), among others. It underscores the market’s vulnerability to geopolitical tensions, which may lead to speculative purchases and inflated prices during times of supply chain disruptions.
IV. Conclusion
This study evaluates the effect of Russia, Ukraine, Netherlands, Norway, and UK’s geopolitical risks on price exuberance in the European natural gas market from 1990M01 to 2022M10, utilizing a GSADF test and logit model. First, the GSADF test reveals recurrent episodes of price exuberance in the European natural gas market. Further, this study identified two instances of price exuberance amidst the Russian-Ukrainian conflict. Secondly, the logit model estimates imply that rising geopolitical risk in Ukraine and UK greatly contributes to the exuberance of European gas prices. However, the data indicate that Russia’s adverse geopolitical risk inhibits the emergence of price exuberance. In conclusion, negative geopolitical circumstances in Netherlands and Norway have had no significant effect on price inflation. One implication of the study is that geopolitical events have a significant impact on price exuberance in the European natural gas market and could be used as an early warning signal for gas price surges in some European countries.