I. Introduction
To achieve universal energy access, clean energy technologies have the greatest potential. Both energy and energy policy could play a vital role in any economy by facilitating the economic process and growth. Many countries and policy makers have put efforts to speed up the diffusion and implementation of low carbon generated energy. Despite significant efforts in developing, diffusing and implementing clean energy in India, it is observed that the development and adoption of these sources in the economy is not as encouraging as expected. Two different but interrelated thoughts that explain the slow diffusion of these technologies are the neo-classical economic paradigm and the systematic character of innovations (Arrow, 1972; Negro et al., 2012). For the neo-classical paradigm, market failure is considered the main barrier. The second academic paradigm basically challenges this neo-classical view. These scholars highlight the systematic character of innovation. As per their view, the development and diffusion of these technologies depend on the kind of ecosystems in which innovations are developed. Other than that, existing empirical studies based on India and other countries focus only on demographic and socio-cultural factors for the adoption of clean energy (Dash et al., 2018; Haq et al., 2024; Ravindra et al., 2019). Against this backdrop, the present study attempts to analyse how the transition story plays out in India and explore the households’ adoption perspective of clean energy vis-à-vis non-clean energy sources using the system of innovation framework.
The remainder of this paper is organized as follows: Following the introduction, section II focuses on the theoretical framework and some of the existing literature on the slow diffusion of clean energy. In section III, we discuss the data sources and methodology employed in the paper. This is followed by results and analysis in section IV. Section V concludes the discussion with a brief policy suggestion.
II. Review of Literature
A. Theoretical discussion
The historical origin of the innovation system could be traced back to the work of List (1841). However, it was Lundvall (1985, 1992) who systematically brought out the modern version and popularised the concept system of innovation in his work. Similarly, Freeman (1987) popularised the national system of innovation[1] (NSI) concept to an international audience while analysing the economic performance of Japan. Edquist (1997, 2005) gave a broader definition, stating that the system of innovation comprises ‘all important economic, social, political, organisational, institutional and other factors that influence the development, diffusion and use of innovations.’ The follow-up literature (Edquist, 1997; Freeman, 1995; Lundvall, 1995; Nelson, 1993) discusses innovation and diffusion using the innovation system perspective (Das, 2022). A system of innovation theory focuses on the interaction among different actors in the system who will acquire knowledge, and this system of innovation could be national, regional or sectoral (Das, 2022). However, another related system function, proposed by Bergek et al. (2008), is the technological innovation system[2] (TIS). The present study uses TIS to discuss the adopters’ perspective on the diffusion, development, and use of clean energy. The theoretical discourse on a system of innovation stresses the adopters’ characteristics, market, and institutional factors responsible for the diffusion and development of any technology.
B. Empirical literature
A number of studies analyse the potential for clean energy to achieve sustainability. Brown et al. (2001) in their study analysed how energy-efficient and clean energy technologies can address key energy and environmental challenges in the US. Gitone (2014) investigates the determinants of the adoption of solar and biogas across Kenya and finds that household characteristics like size of the household and educational level do significantly affect the adoption of solar and biogas. Rafiq et al. (2014) made a comparative analysis by taking time series data from 1972-2011 between India and China and examined the causality between output, carbon emission, and renewable energy generation. For India, it is proved that in the short run there is a unidirectional causality from carbon emission to generation of renewable energy and then renewable energy to output, whereas, in the long run, it is found that there is a bidirectional causality. However, the experience of China is reversed. A recent study by Li et al. (2022) discusses the determinants of clean energy adoption by rural households in western China. The study emphasizes psychological factors like mentality as a crucial factor for farmers’ clean energy adoption. Though not clean energy diffusion, at par with the theoretical literature, Das (2010a, 2010b, 2013, 2014) and Das & Das (2017), in their study, also emphasise adopters’ characteristics, infrastructural factors, and institutional factors as determinants of diffusion of any technology. The present study adopts this conclusion and attempts to analyse the households’ behaviour in adopting clean energy.
III. Data and Methods
We use the microdata from various rounds of the National Sample Survey Organisation (NSSO) to understand the adoption of different clean and non-clean energy sources by households over the years. Households use different energy sources for both cooking and lighting. We use six rounds of NSSO – 38th, 55th, 61st, 66th and 68th rounds – for the analysis. To determine the adopters’ perspective towards clean energy, we use time use survey data of NSSO for the year 2018-19 as this is the latest round which contains different sources of energy use by Indian households. To determine the adopters’ perspective, a household is the unit of analysis. Either the head of the household or the representative of the household is the respondent. Our sample comprises 1,38,799 households with a disaggregation of 82,897 rural and 55,902 urban households.
A descriptive approach has been deployed to dissect the variables of interest. To understand the dynamics of clean energy adoption for cooking, we have adopted logistic regression analysis. Since the dependent variable is in binary form, the logit model will be appropriate to understand the dynamics. The regression used in our analysis takes this form
ln(Pi1−Pi)=α+β1X1+β2X2+β3X3+β4X4+β5X5+β6X6+β7X7+β8X8+β9X9+β10X10+β11X11+β12X12+β13X13+β14X14+β15X15
IV. Results and Discussion
The first section discusses a comparative analysis of energy sources used for cooking across households.

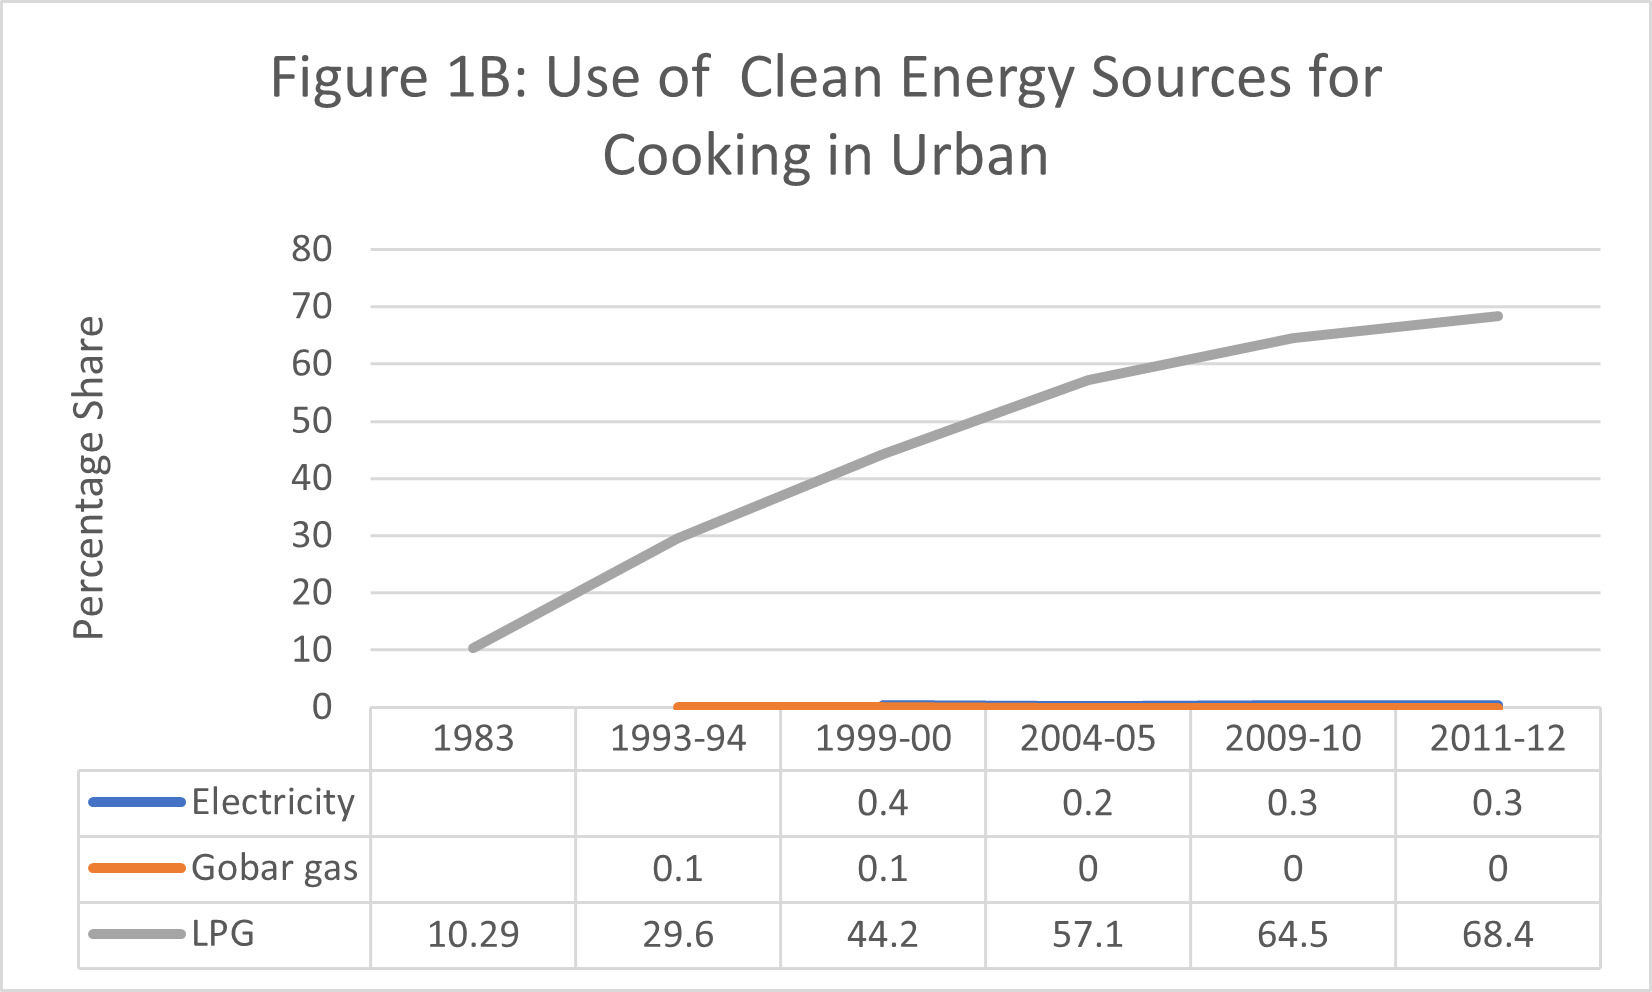
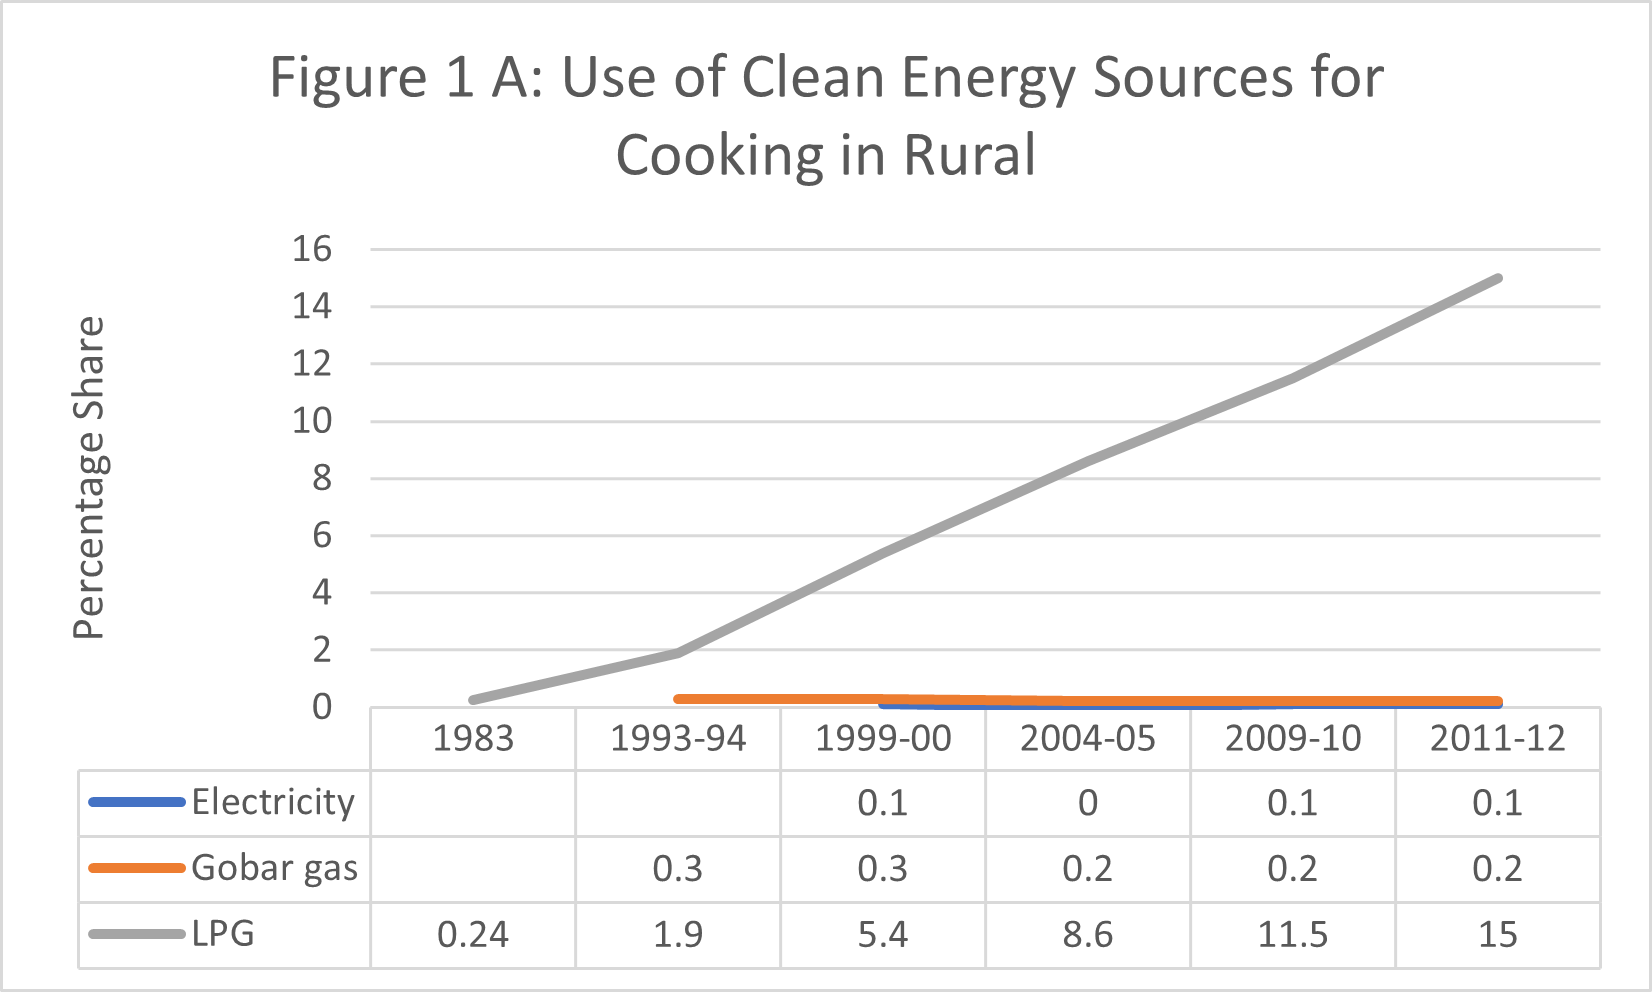
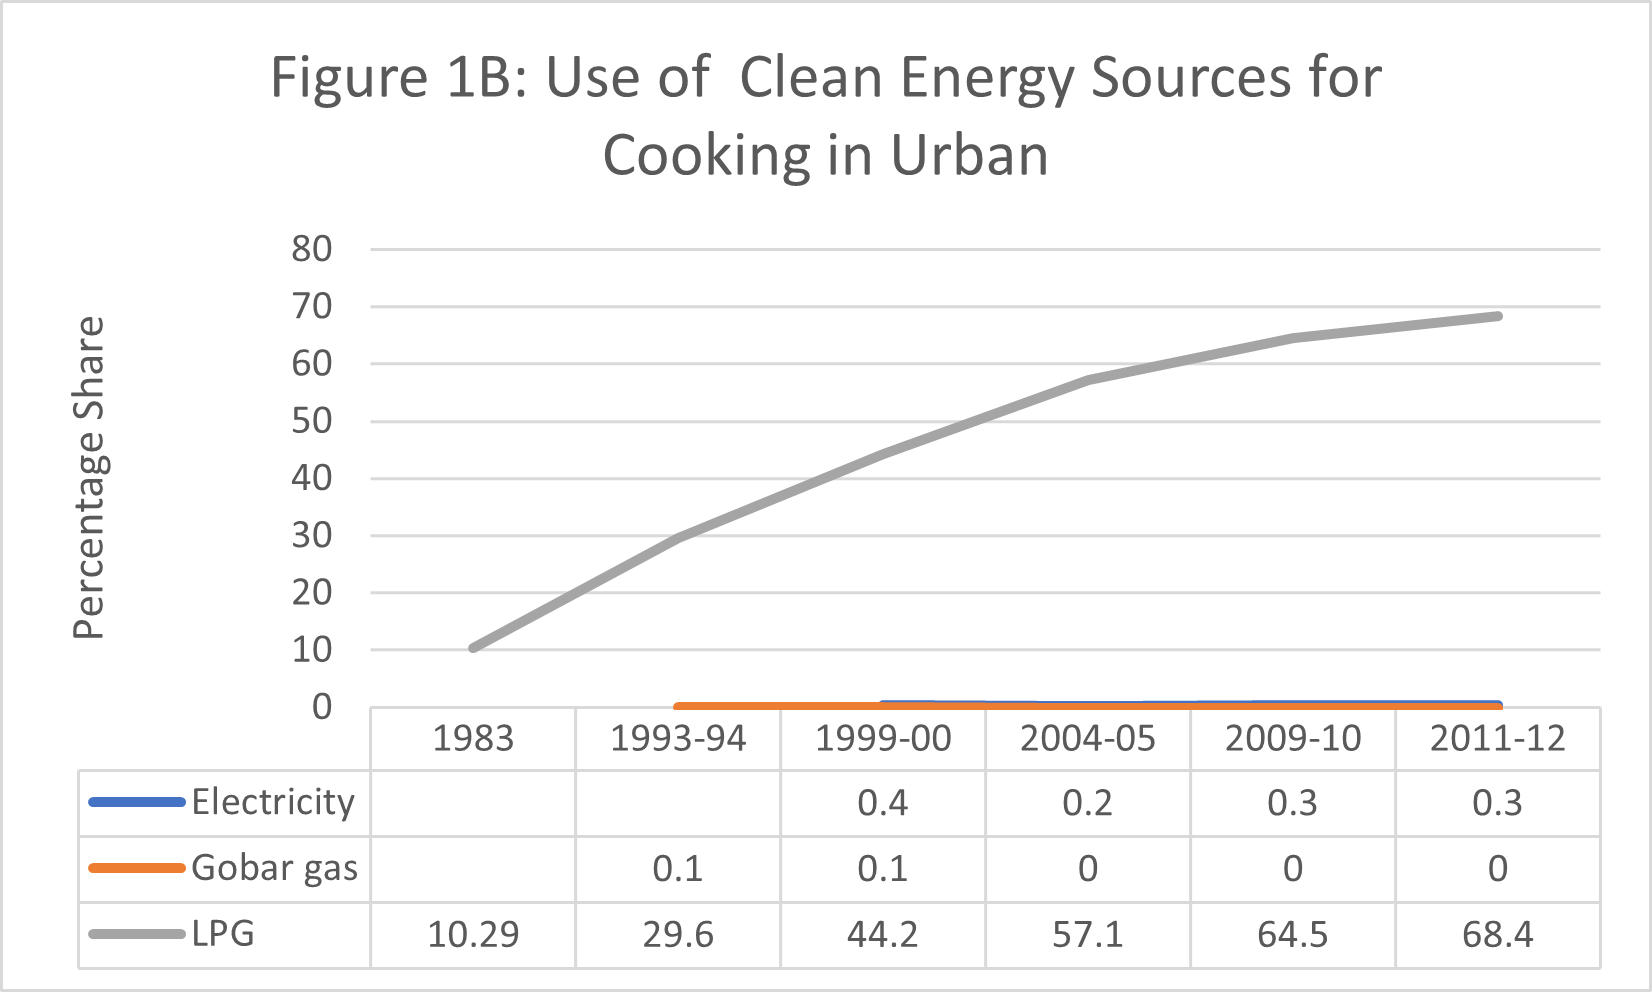
Figures 1 A and B present households’ preferences for clean energy sources over the years in rural and urban areas, respectively. The use of electricity and gobar gas for cooking is almost minimal in rural areas. An increasing trend of LPG adoption over the years has been observed. In 1983 and 1993-94, the percentage of households using LPG is minimal. This could be due to the lack of distributors in rural areas. In 1999-00, only 5.4 per cent of households reported using LPG, which increased to 15 per cent in 2011-12. The percentage of urban households using LPG was 10.29 per cent in 1983, which increased to 68.4 per cent in 2011-12.
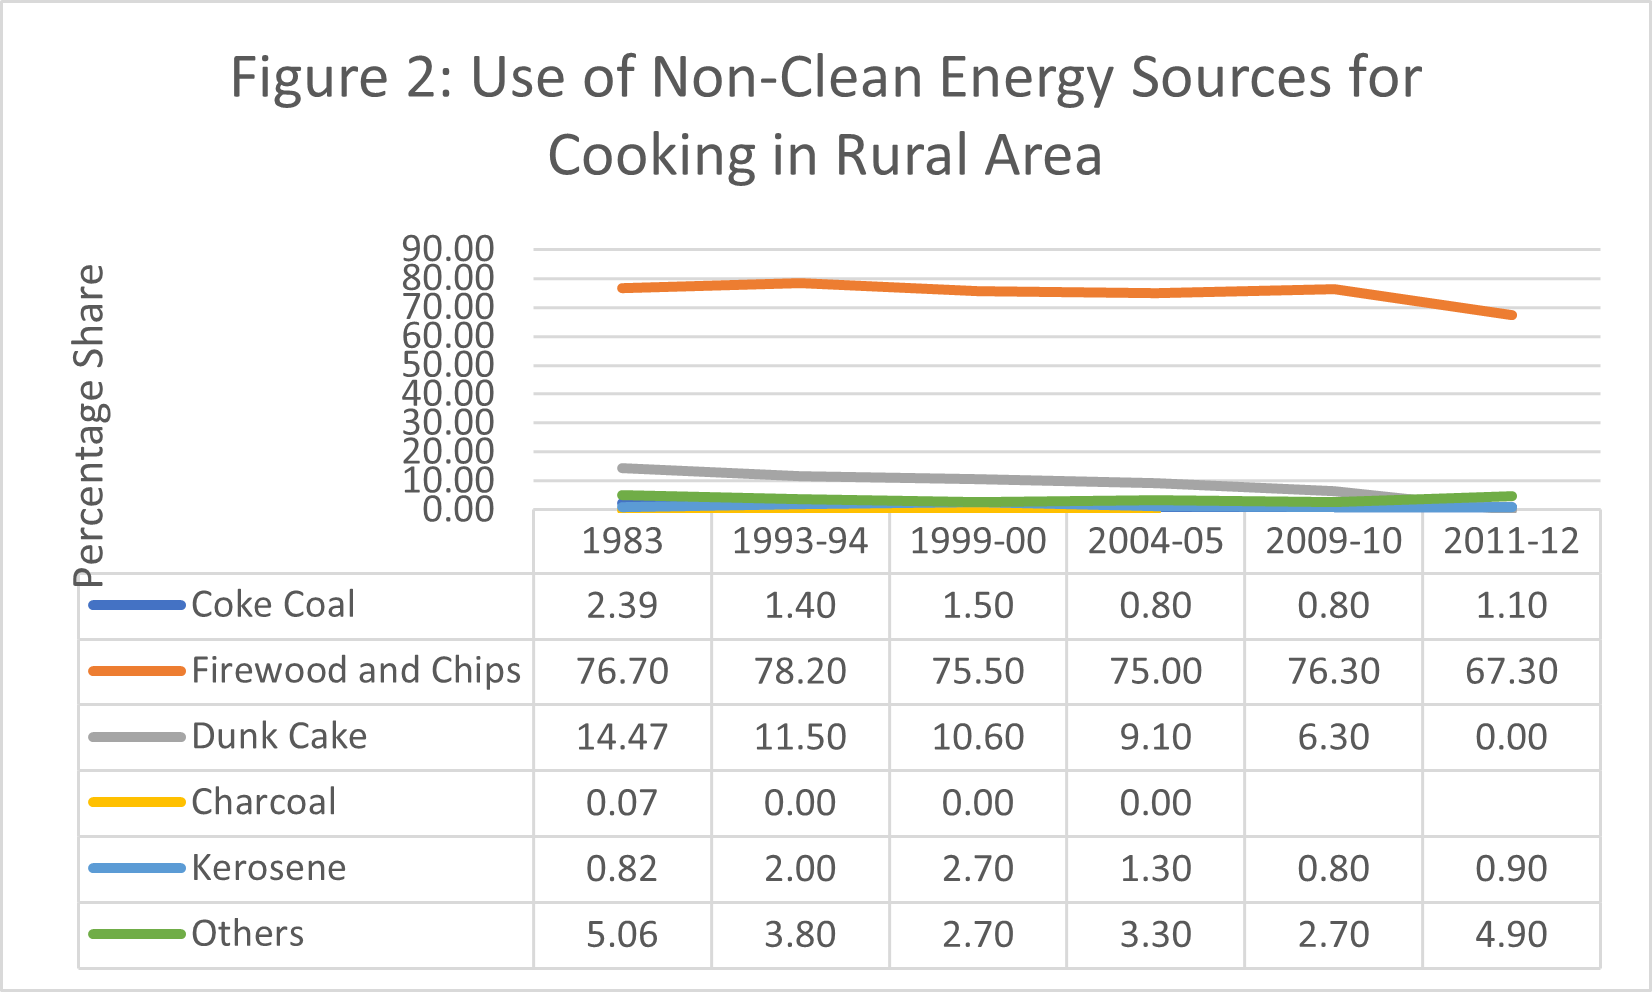
The adoption of non-clean energy sources shows that rural households mostly use firewood and chips followed by dunk cake. The use of firewood and chips by rural households is almost stagnant till 2009-10. It only reduced in 2011-12

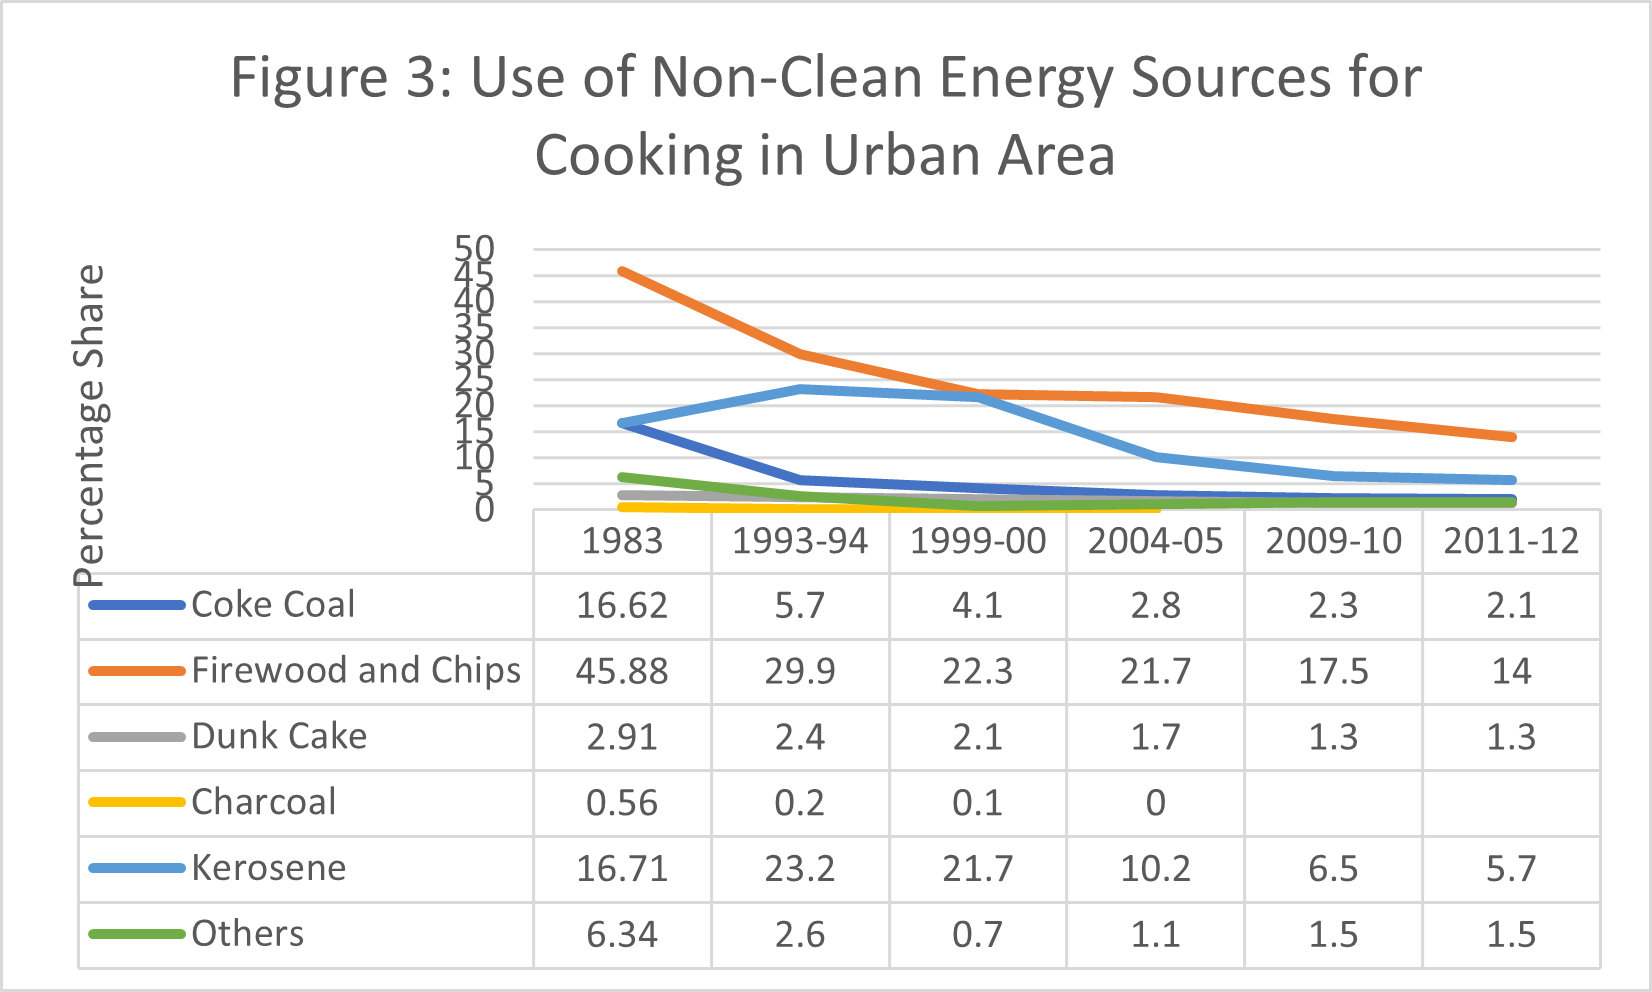
Similar situations prevail regarding the use of non-clean energy sources in urban areas. However, the use of firewood and chips in urban areas has been reduced over the years.

Having discussed the distribution of clean and non-clean energy sources over the years, the following section attempts to analyse the determinants of clean and non-clean energy sources. The results show that the adoption of clean energy sources has a significant bearing on adopters’ characteristics as well as market and infrastructure factors. We found all the variables that are entered as adopters’ characteristics have a significant influence over the households’ adoption of clean energy. With the increase in households’ income[3], the chances of adoption of clean energy increase by 15 per cent. This implies that economically better-off households have a higher probability of adopting clean energy. With the increase in household size, the expected probability of a household having secondary or higher education increases by two per cent. Compared to the ST households, the expected probability of adopting clean energy for the SC households increases by six per cent. However, compared to the ST households, the expected probability of having secondary or higher education for OBC households increases by ten per cent, and the other households (General) by 13 per cent. If households are from urban areas, the expected probability of adopting clean energy increases by 23 per cent. The marginal effects at mean point out that if the highest level of education for the households is either graduation or post-graduation, then the chances of clean energy adoption increase by one per cent.
To capture the market and infrastructure perspective for clean energy adoption, we have included share of LPG distributors per 10,000 population across states as an independent variable. This variable has the highest impact on clean energy adoption for cooking. The result shows that if the share of LPG distributors increases, then the chances of adoption increase by 51 per cent. This proves the importance of the infrastructure perspective of diffusion of any technology.
V. Conclusion
The Sustainable Development Goal (SDG) 7 aims to ensure affordable and clean energy. The SDG 7.1 aims to ensure universal access to affordable, reliable, and modern energy services by 2030. Prime Minister Ujwala Yojana’s objective is to make LPG, a clean cooking fuel, available to rural and deprived sections of India. In this context, we examine the transition of clean fuel adoption among Indian households.
In general, adopters’ characteristics, such as the economic conditions of the households, members of the households, their social groups, and educational level, significantly affect the adoption of clean fuel. The ST households face significant disadvantages in adopting clean energy. However, the study found that the infrastructure variable has the highest influence over the adoption of clean energy.
It is defined as ‘the network of institutions in the public and private sectors whose activities and interactions initiate, import, modify and diffuse new technologies’ (Freeman, 1987).
It refers to ‘a socio-technical system focused on the development, diffusion and use of a particular technology’.
Expenditure has been taken as proxy for income.