I. Introduction
Energy is a pivotal driver of global development across various socio-economic levels. The rise in fossil fuels as a primary energy source since the late 19th century has empowered industrialization, transportation, consumer goods production, and heating worldwide. Nevertheless, the widespread reliance on fossil fuels has led to climate change, resulting in global temperature and weather pattern shifts.
Globally, countries have committed to reduce greenhouse gas emissions in response to the urgency of redeeming climate change. This commitment culminated in the 2015 Paris Climate Agreement, which aimed to limit global temperature to below 2℃ above pre-industrial levels with a stronger ambition to stay below 1.5℃ (Maizland, 2022). Additionally, many nations, including Nigeria, have pledged to transition to greener, more sustainable energy sources, such as solar, wind, and hydropower.
Nigeria, a signatory of the Paris Agreement, has set ambitious targets, including an unconditional 20% emissions reduction by 2030 and a revised conditional 47% emissions reduction pledge. Additionally, Nigeria aspires to achieve carbon neutrality by 2060, supported by policies like the Energy Transition Plan and the Climate Change Act of 2021.[1]
To attain these climate goals, Nigeria must determine its optimal energy mix. This study employed a threshold regression analysis to investigate the energy mix, examining the balance between non-renewable and renewable energy sources and their impact on carbon emissions. This study’s objective is to identify the point at which increased non-renewable energy consumption becomes unsustainable and hinders the country’s energy transition objectives.
Despite their low adoption, renewable energy technologies, including solar power, wind, hydropower, bioenergy, geothermal energy, and ocean energy, can provide a significant proportion of the world’s energy needs (Saidur et al., 2010). To significantly reduce greenhouse gas emissions, the share of renewable energy sources must be more than 60 per cent of the global energy mix to reach the milestones in Net Zero Emissions by 2050 (International Energy Agency, 2021). Thus, strategies can be adopted to reduce carbon (CO2) emissions. Metcalf (2019) explored the role of carbon pricing mechanisms and national emissions targets in facilitating deep decarbonization, and Stokes (2013) provided an overview of policy instruments used to support renewable energy deployment, including feed-in tariffs, auctions, and tax incentives such as investment tax credits and tax exemptions. Notably, renewable energy sources provide opportunities including job creation, energy access for remote areas, and enhanced energy efficiency.
In the domestic space, while some studies have explored the adoption, potentials, and challenges of renewable energy in Nigeria (Nwosu & Anyanwu, 2021; Oyedepo et al., 2020), others have conducted a comprehensive review of Nigeria’s renewable energy development (Adegboyega et al., 2019; Anyanwu & Ajayi, 2018). However, all these studies were largely descriptive and review-based.
Consequently, our study employed an empirical approach to examine Nigeria’s need to transition to renewable energy sources. To the best of our knowledge, this study is the first to estimate Nigeria’s optimal energy mix. More so, it is the first use of the threshold analysis methodology for Nigeria, based on Bassongui et al.'s (2021) work, which focused on sub-Saharan countries. This methodology provides a framework to capture nonlinear relationships and abrupt shifts in the energy mix, which are essential for understanding the complexities of energy transition dynamics.
The remainder of this paper is structured as follows: Section II details the data sources and methodology used in the analysis. Section III presents and discusses the results. Finally, Section IV concludes the study and offers policy recommendations.
II. Data and Methodology
We obtained annual data from the World Bank database (1990–2022) on carbon emissions per capita, fossil fuel and renewable energy production (quad Btu), Gross Domestic Product (GDP) per capita in local currency, and urban population growth. The annual data was then converted into quarterly series using the quadratic sum function to provide a more detailed analysis. Finally, we computed energy mix as the share of renewable energy (fossil fuel) production to the total energy production. Although some studies computed energy mix as the share of energy consumption (Bassongui et al., 2021; Gielen et al., 2019), this study found energy production to be more relevant, as it is often more directly influenced by government policies, incentives, and investments. Thus, tracking the share of renewable energy in production aligns with policy goals aimed at increasing the use of renewable sources in the energy mix.
Based on this study’s objective, we employed a threshold regression model to examine nonlinear relationships between our variables. Specifically, we investigated changes in the dependent variable (carbon emissions per capita) based on the value of our threshold variable (energy mix) by allowing the coefficients of our explanatory variables to differ across threshold levels. The approach recognizes that different energy mixes may have varying impacts on carbon emissions, and the relationship may be nonlinear and characterized by distinct regimes.
We specified our model based on Tong’s (1983) work as follows:
lnΔ(co2)=α1+β1lnΔ(renewg)+β2lnΔgdppc+β3upopg+εi,re_mix≤γ0
Δln(co2)=α2+δ1lnΔ(renewg)+δ2lnΔgdppc+δ3upopg+εi,re_mix≥γ0
Where (energy mix) is the threshold variable, and is the true threshold value. and represent the log difference of our dependent variable namely carbon emissions per capita, and our region dependent variable named renewable energy production. Meanwhile, our region independent variables are the log difference of GDP per capita named and the urban population growth rate is Finally, represents the error term which captures unobserved factors that influence carbon emissions. Notably, equations 1 and 2 show the relationship between our dependent and independent variables when the energy mix is below and above a certain threshold.
III. Results and Discussion
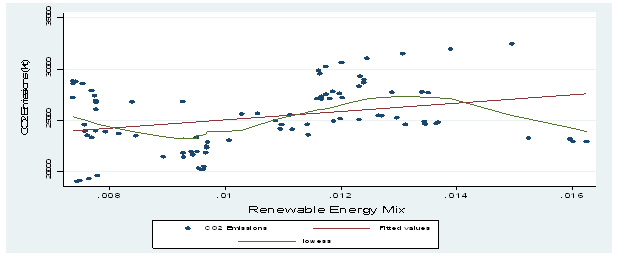
In conducting our analysis, we initially checked for evidence of non-linearity in our threshold variable (energy mix) to confirm the appropriateness of using a threshold regression. Figure 1 shows clear evidence of non-linearity in the energy mix as depicted in its spread around the Lowess curve, which confirms the validity of using a threshold regression.
.png)
Next, we used the log differences of our variables to attain stationarity in our series, as confirmed by the Dickey-Fuller test. Consequently, we run a threshold regression, as in equations 1 and 2, using the Bayesian Information Criterion (BIC), to select the optimal number of thresholds from a maximum of three (3) thresholds, where the optimal threshold is one (1) (see Table 1).
Our results indicate a threshold level of 1.3397 per cent, below which an increase in renewable energy production will result in a significant increase in carbon emissions. Specifically, when the energy mix is less than or equal to 1.3397 per cent, a 1 per cent increase in renewable energy production would result in a 0.29 per cent increase in carbon emissions. However, as the energy mix exceeds the threshold level, increased production of renewable energy would result in a significant decrease in CO2 emissions by 0.51 per cent. Our findings align with established expectations and corroborate the conclusions in previous research. Chen et al. (2019) and Saleem et al. (2022) have observed a similar relationship and asserted that a higher proportion of renewable energy production translates into diminished carbon emissions.
Our results indicate that growth in GDP per capita contributes significantly to carbon emissions by about 0.78 per cent; this may be due to increased energy consumption and industrial production from fossil-fuel based energy sources (Alaganthiran & Anaba, 2022; Sikder et al., 2022). On the other hand, growth in urban population results in a significant decline in carbon emissions, due to more energy efficient infrastructure in urban areas (Luqman et al., 2023; Sun & Huang, 2020).
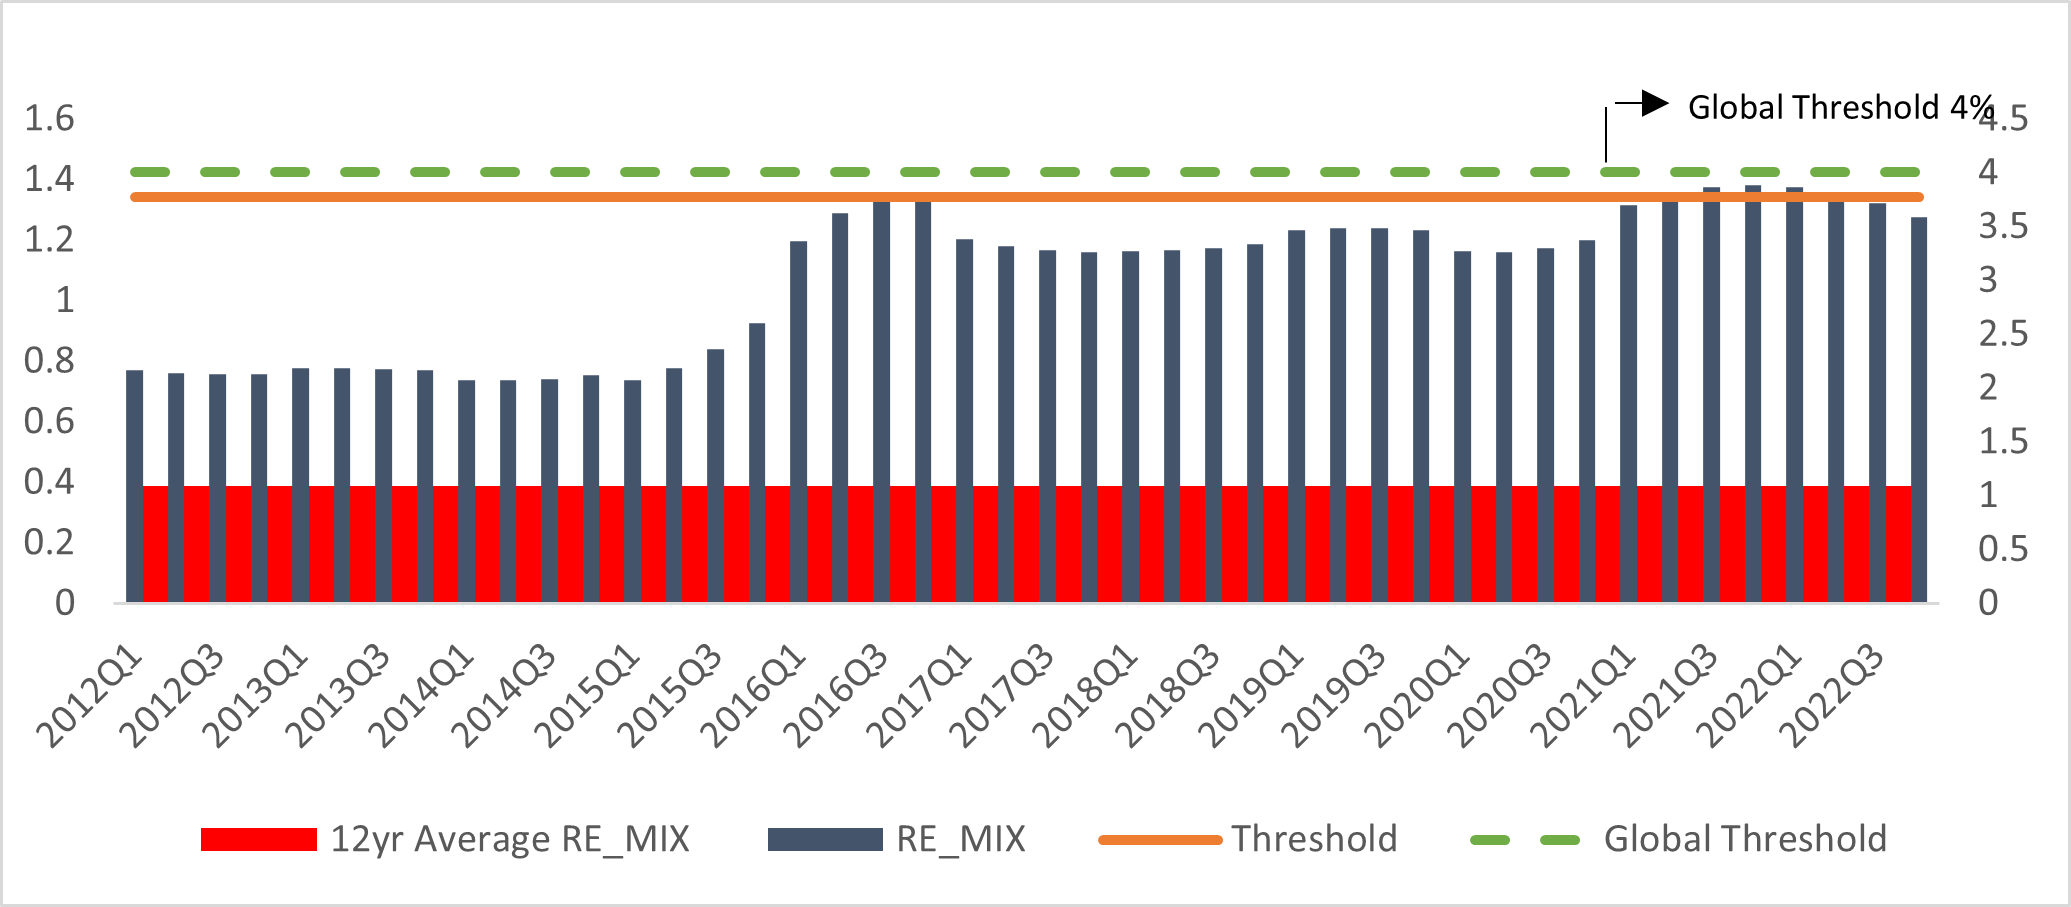
To further buttress the validity of our results, we conducted a granger causality test to ascertain our variables’ effects on carbon emissions (see Appendix 1). The test indicated that GDP per capita, urban population growth, and energy mix granger cause carbon emissions. Our results posit that over a 12-year period, Nigeria’s energy mix consisted of averagely 1.09 per cent renewable energy, which was below the optimal threshold mix of 1.3397 per cent and the current global energy mix of 4 per cent (Figure 2).
.png)
IV. Conclusion and Policy Recommendations
This study aimed to determine the optimal energy mix for Nigeria’s transition towards greener alternatives using a threshold regression analysis. The results indicated that Nigeria’s energy mix has a threshold level of 1.34 per cent. At or below this threshold level, carbon emissions will increase; above the threshold level, carbon emissions will decrease.
Additionally, the results showed that growth in GDP per capita had a significant positive effect on carbon emissions due to increased economic activities and the burning of fossil fuels, particularly for industrial purposes.
To meet Nigeria’s energy transition objectives, coordinated and focused policy initiatives from both monetary and fiscal authorities are needed. Fiscal authorities should intensify the deployment of green finance initiatives such as Green Bonds by the Debt Management Office. Fiscal authorities should also consider implementing carbon pricing mechanisms, such as carbon taxes or cap-and-trade systems to incentivize businesses to reduce their carbon footprints.
Simultaneously, monetary authorities, particularly the Central Bank of Nigeria, should prescribe sustainable banking guidelines which would require financial institutions to incorporate environmental and social considerations into their lending and investment decisions. This would promote funding for low-carbon businesses and reduce support for carbon-intensive industries.
The large-scale adoption of more green alternatives such as solar, wind, and hydro power across the country is not completely feasible due to high costs. A temporary but viable option would be substituting high-carbon emitting fuels, such as coal and crude oil with lower-carbon emitting or transition fuels, such as natural gas and Liquified Natural Gas (LNG). This can be done by strengthening the security of the country’s pipeline infrastructure and establishing more natural gas processing plants.